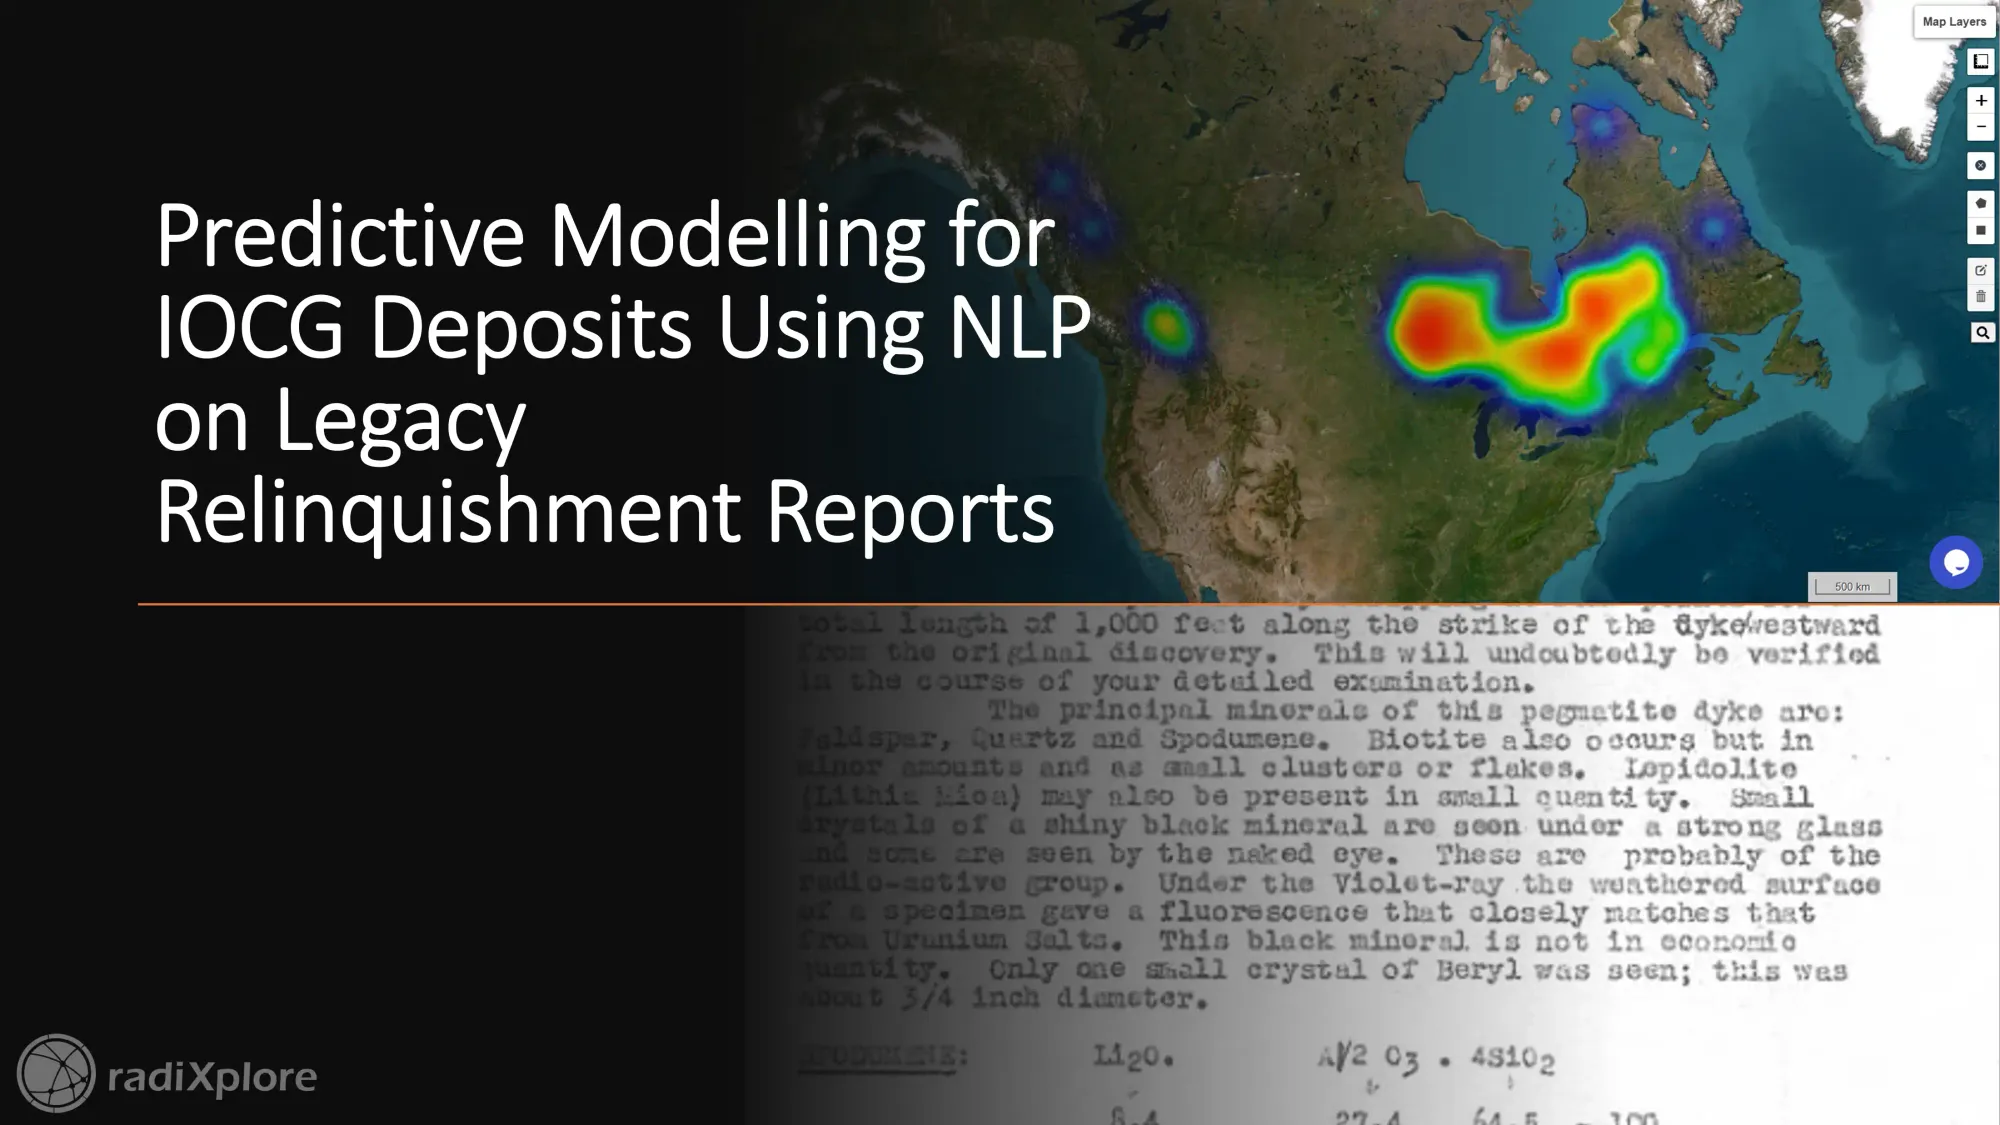
AI-Powered Predictive Modeling for IOCG Deposits: Analyzing Legacy Relinquishment Reports with NLP - PDAC Talk
Discover how AI-powered predictive modeling analyzes open-file reports, handwritten legacy data, and assessment reports to unlock hidden mineral deposits. Revolutionize exploration with cutting-edge tech!

Introduction to Predictive Modeling
Predictive modeling is an advanced technique that employs machine learning algorithms, statistical methods, and mathematical frameworks to forecast the presence of mineral deposits in unexplored areas. By analyzing patterns in existing datasets—such as geophysical surveys, geological maps, and geochemical data—predictive models can identify potential locations of undiscovered mineral systems. This approach is revolutionizing the mining industry by accelerating discoveries and reducing exploration risks.
Companies like KoBold Metals and Earth AI are leveraging these techniques to refine their exploration strategies. Additionally, service providers such as VRIFY, SRK Consulting, and SensOre offer predictive modeling as a service, enabling explorers to make data-driven decisions. Government geological surveys like Geoscience Australia, often with substantial budgets, also conduct similar studies to guide national exploration efforts and stimulate industry interest.
The Importance of Predictive Modeling
Traditional geological methods have long relied on correlating datasets like potential field data, surface geochemistry, and structural interpretations to identify promising exploration targets. However, these methods often depend heavily on expert judgment and manual processes, which can be time-consuming and prone to bias. The human mind struggles to quantitatively analyze complex, multidimensional datasets, especially at regional or continental scales.
AI-powered predictive modeling enhances these traditional approaches by integrating and analyzing vast amounts of data simultaneously. This allows geologists to identify subtle patterns, reduce bias, and generate probabilistic maps that highlight areas with high mineral potential. For instance, Geoscience Australia has produced regional-scale predictive maps for Iron Oxide Copper Gold (IOCG) deposits, helping prioritize exploration efforts across the continent.
By combining geological expertise with AI-driven insights, predictive modeling empowers explorers to make smarter, faster decisions, ultimately accelerating discovery timelines and increasing the chances of finding economically viable deposits.
Simplified Step-by-Step Approach to Predictive Modeling
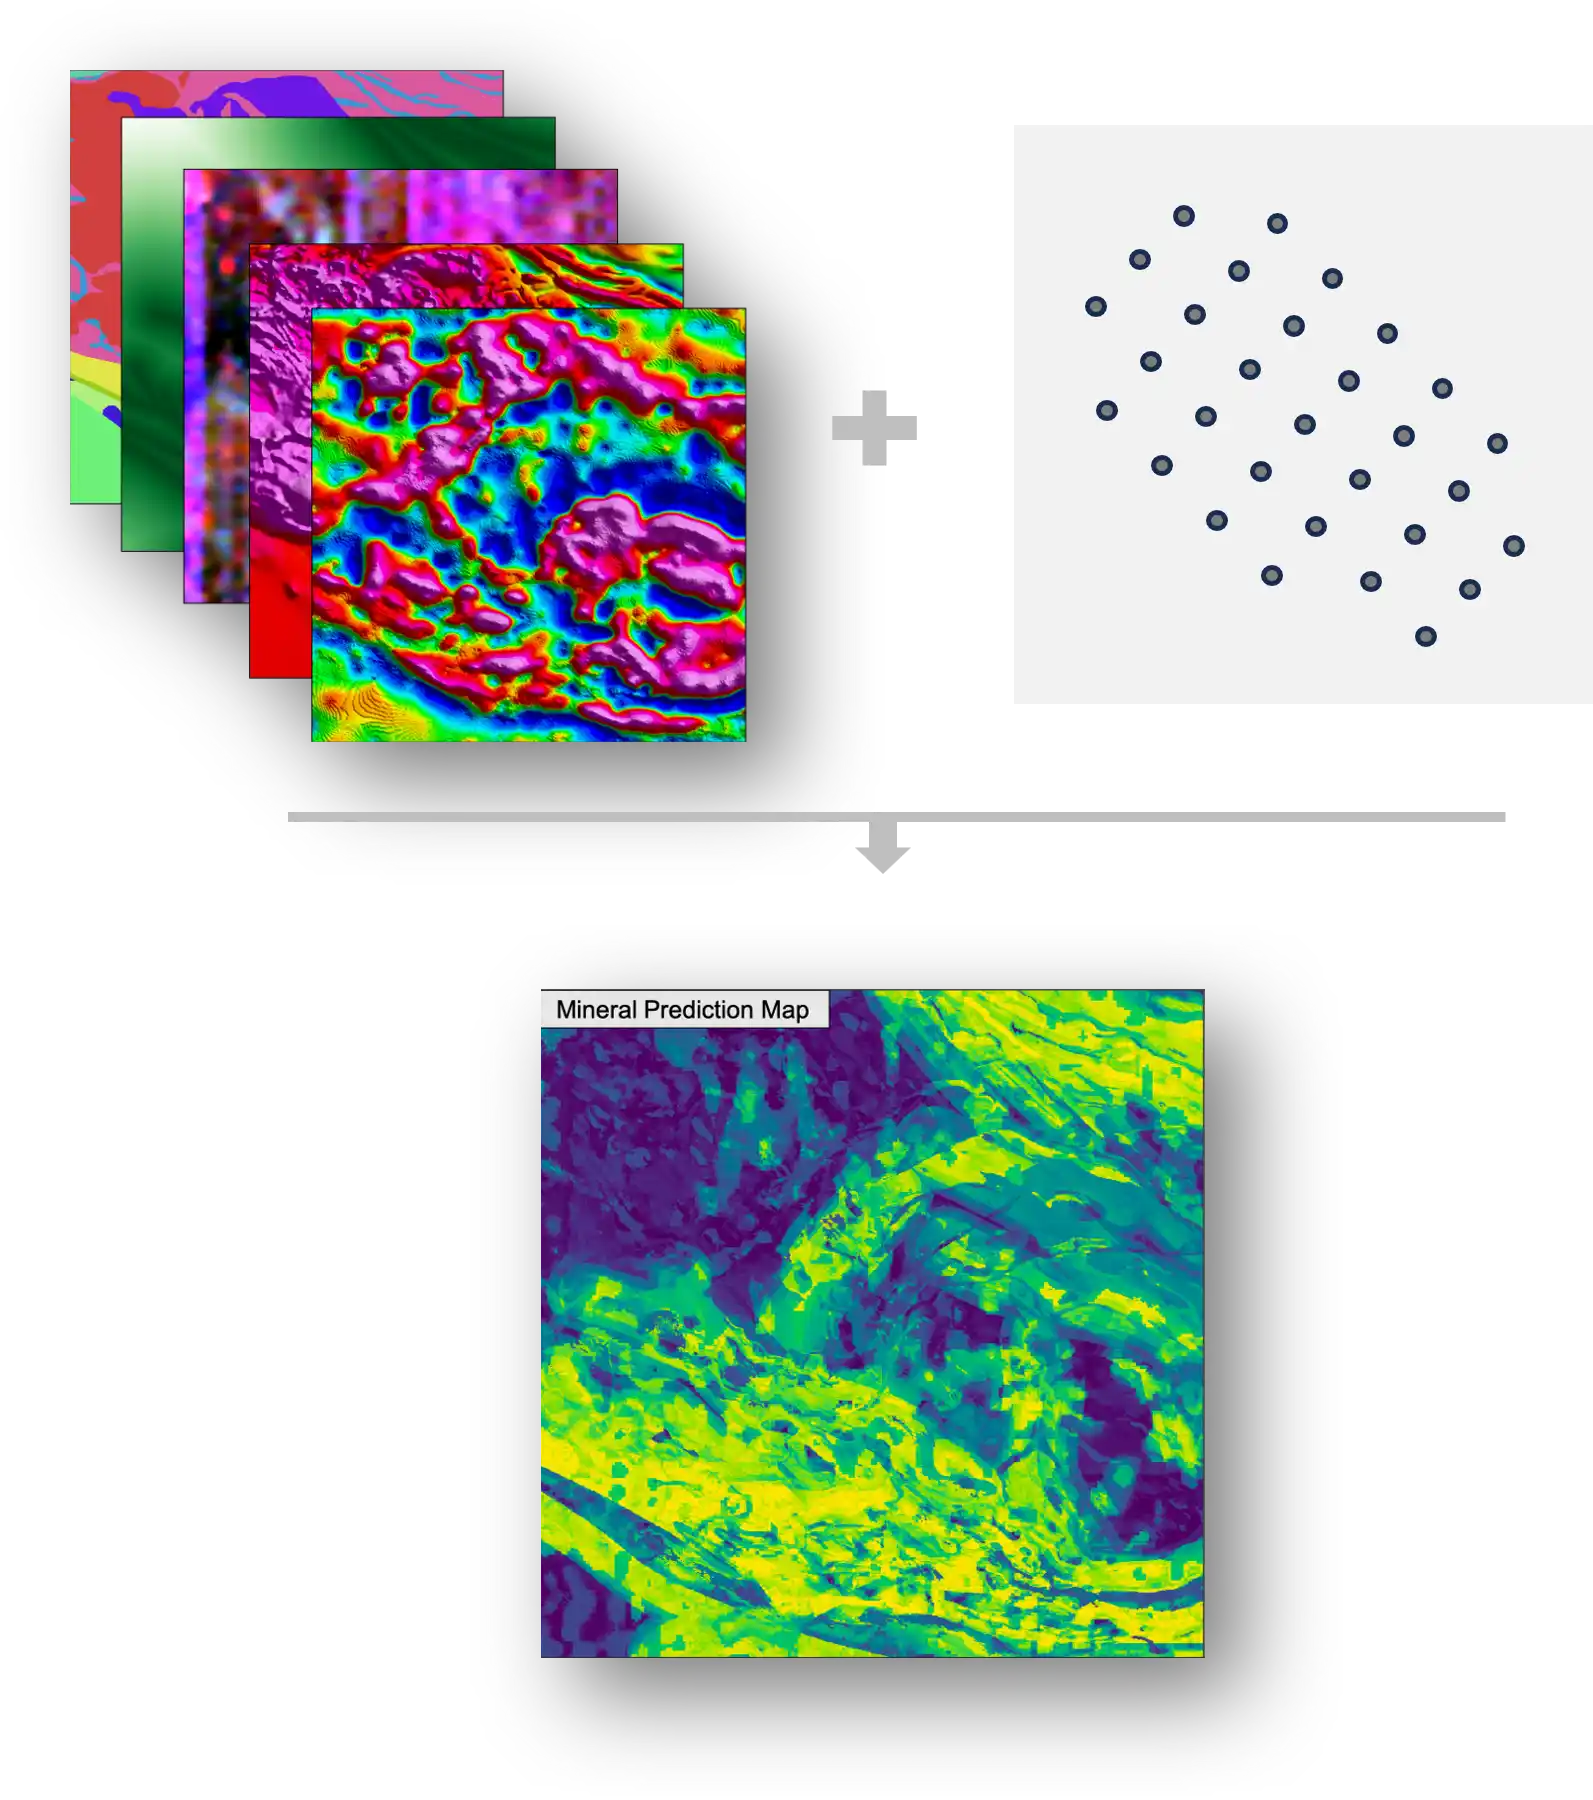
- Input Data: Collect datasets that are consistently available across a region, such as potential field (PF) data, geological maps, and distance to faults. These structured datasets provide the foundational layers for building predictive models.
- Target Data: Use known assay grades from existing drill holes as the target variable. For example, in copper exploration, calculate the mean or maximum copper grade at each drill hole location to serve as the model’s training output.
- Model Creation: Build a machine learning model that correlates the input and target data. For every XY location with drill hole data, the model learns the relationship between the input features (like magnetic intensity or fault distance) and the assay value. Once trained, the model can predict assay values across the entire region—even in areas with no drilling, as long as input data is available.
This methodology underpins regional-scale mineral potential maps, such as the IOCG prospectivity maps produced by Geoscience Australia. However, these models are only as good as the data they rely on—structured datasets are meticulously cleaned, processed, and stitched together by teams of geoscientists over many years.
But what about unstructured datasets, like historical reports, field notes, and legacy exploration records? How are these currently used, and what opportunities lie in unlocking their insights through AI? Let’s explore that next.
The Missing Piece: Unstructured Data in Mining Exploration
What is Unstructured Data?
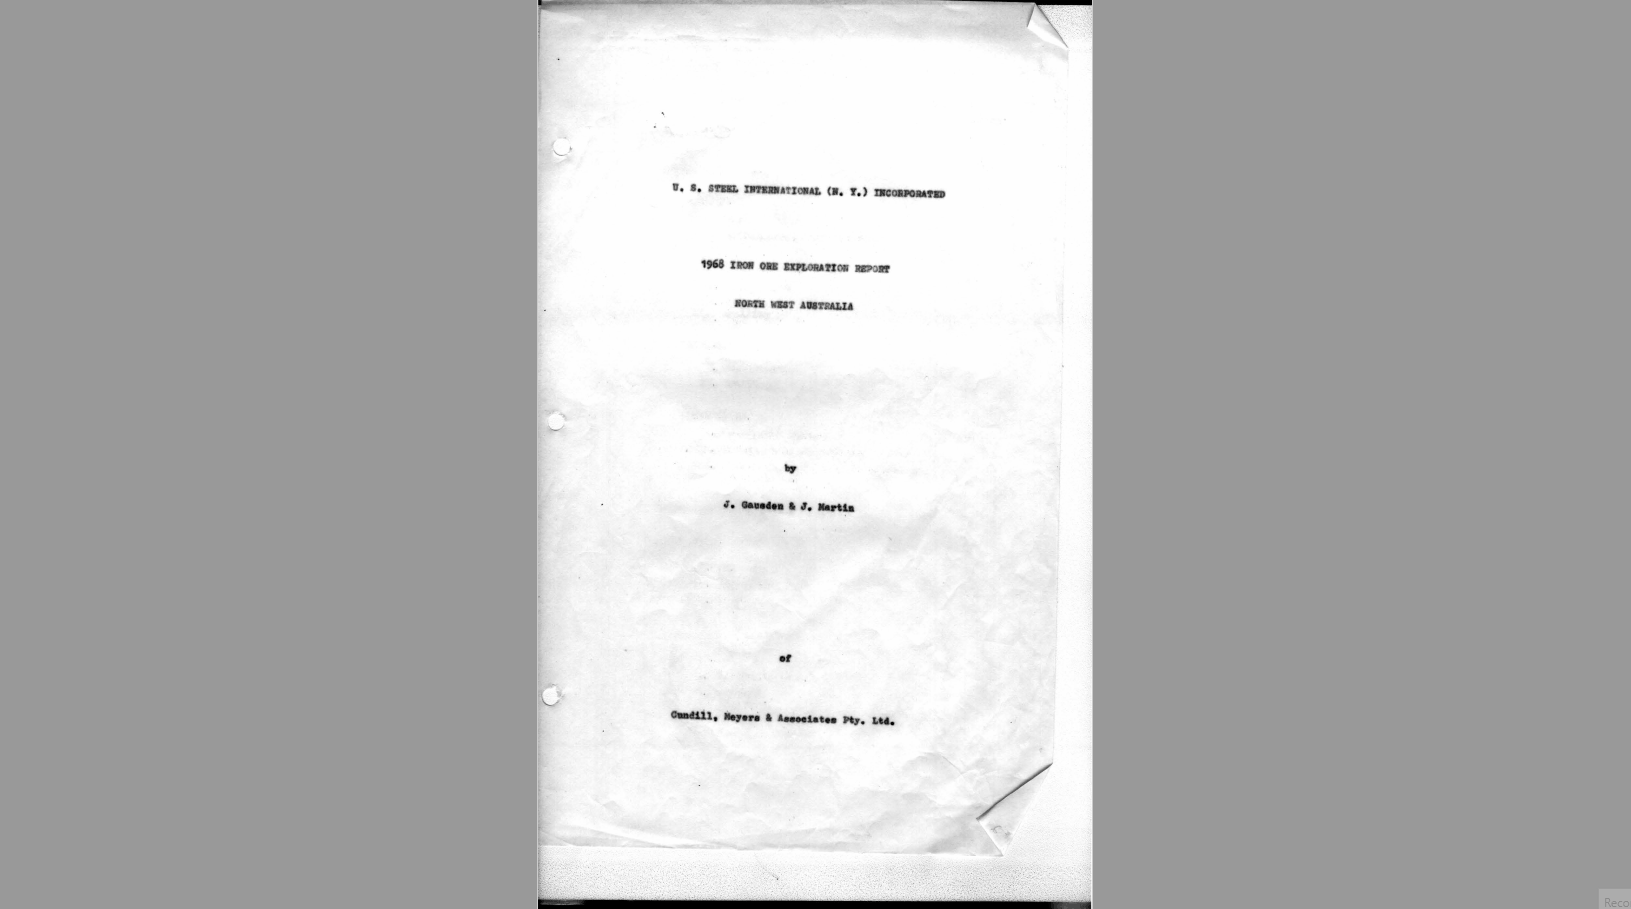
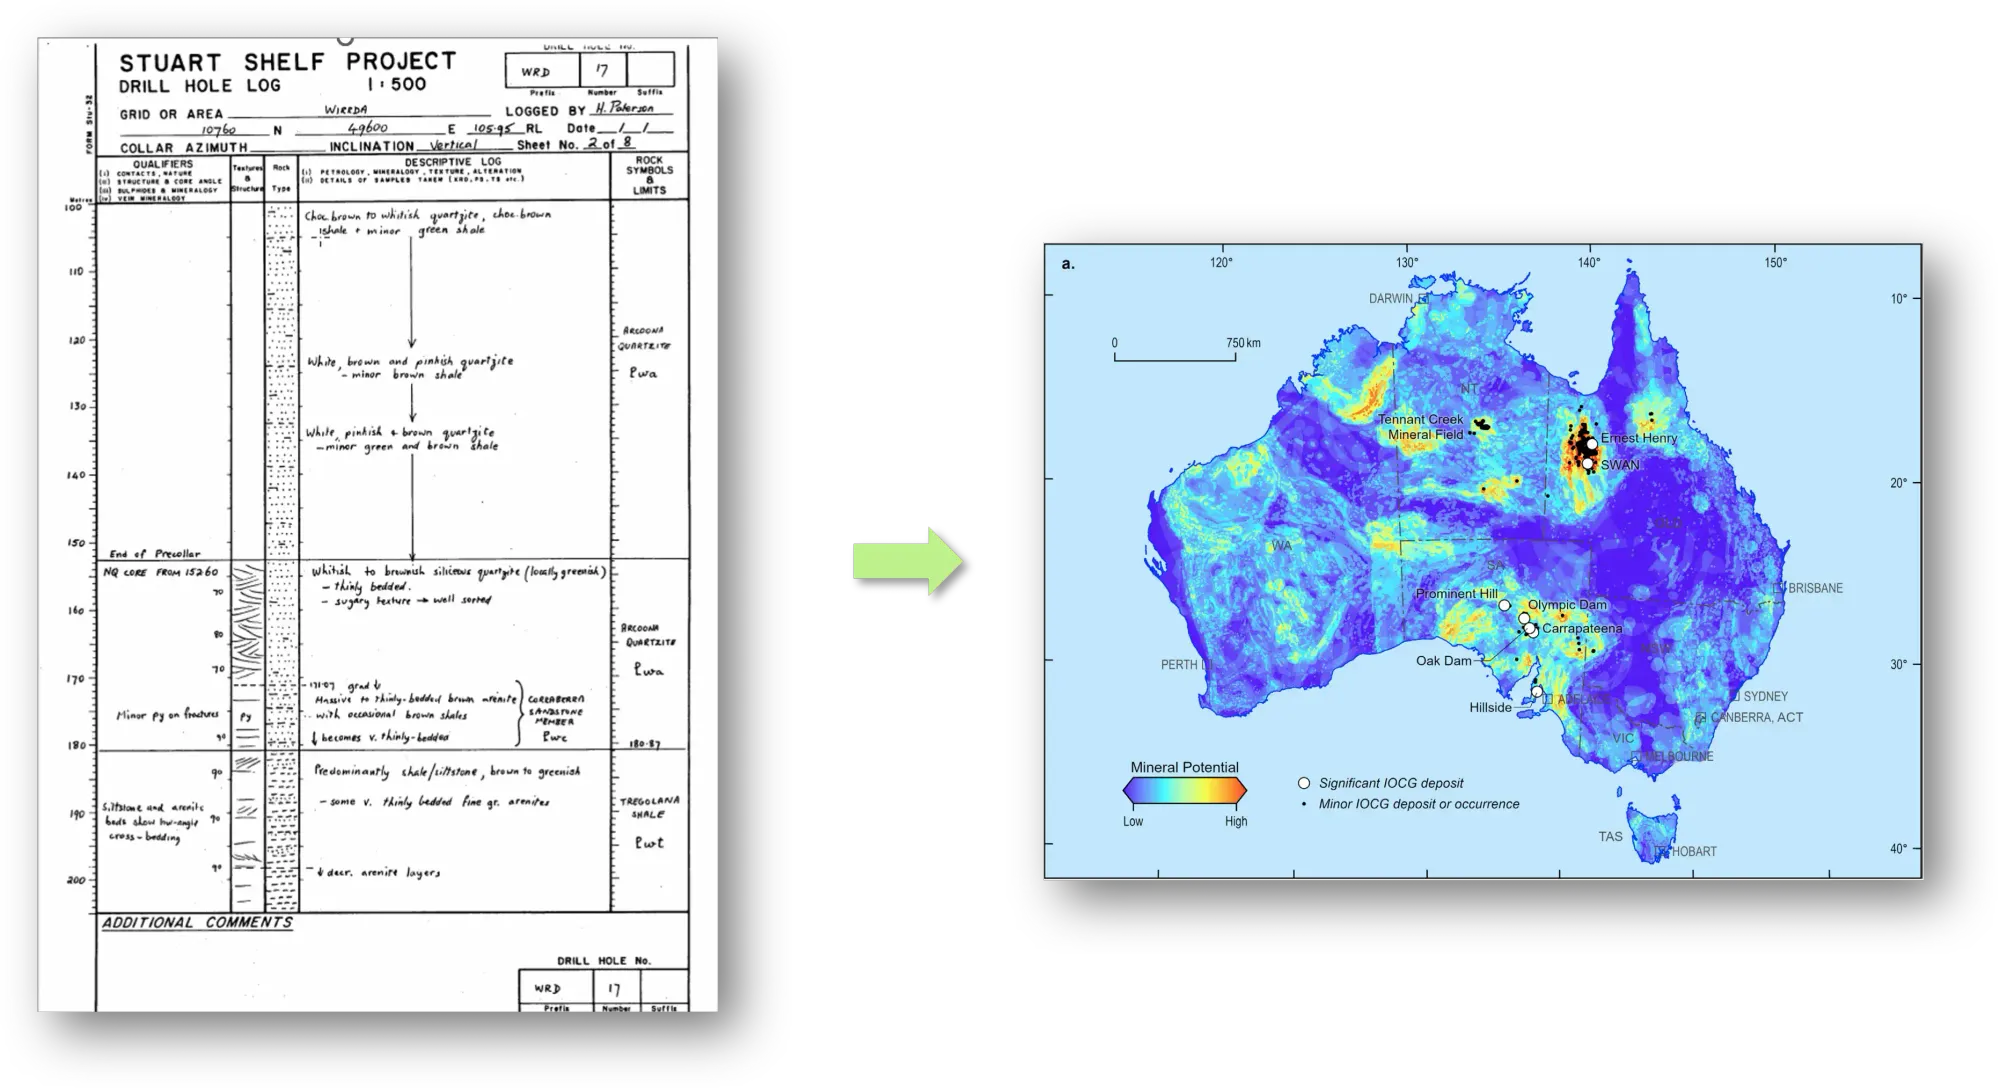
Unstructured data refers to information that doesn’t fit neatly into a structured database or spreadsheet format—typically text, images, or scanned documents. In mining exploration, this includes relinquishment reports, company announcements, exploration field notes, core descriptions, historical geological maps, and legacy reports. These documents are often handwritten or exist as image scans, making them difficult to process with traditional methods.
Why It Matters
These historical reports contain decades of invaluable exploration knowledge—but most of it remains locked away, largely inaccessible to modern exploration workflows. Manually extracting and digitizing information from these reports is extremely time-consuming and impractical at scale. In fact, a survey we conducted showed that companies typically access less than 1% of the insights hidden within these historical documents.
Current approaches only scratch the surface: geologists often digitize small, selective portions of reports to convert them into structured datasets, while the vast majority of knowledge remains buried in text and images that are challenging to analyze systematically.
But what if we could change that? What if we could apply the same predictive modeling principles to unstructured text?
Creating a “Pseudo” Mineral Prospectivity Map from Text
Imagine if a geologist could read through millions of historical reports, extract relevant geological observations, and map potential deposit locations geospatially. Here’s how that process could look:
- Reading Through Text: They would sift through pages, read and understand text and images in historical reports—identifying key geological terms, deposit indicators, and relevant observations.
- Location Mapping: For every valuable piece of literature they identify, they would map the location based on the historical exploration area of interest.
- Scalability: To make this process feasible, they would need to read millions of documents. For instance, Australia has over 50 million relinquishment reports created over the past 200 years. From these, a geologist would need to identify recurring text patterns, descriptions of mineralization, and subtle indicators of specific deposit types (such as IOCG systems).
The result? A mineral potential map generated purely from historical text data, complementing traditional structured datasets. This would unlock hidden opportunities, prioritize field programs, and give a competitive edge—by resurfacing insights that would otherwise remain buried in archives.
But, unfortunately, while this sounds exciting, it’s not possible, even with an army of humans. This is where AI can help.
A Novel Approach: Using NLP to Analyze Unstructured Data
The concept of reviewing historical documents for exploration insights isn’t new—geologists have done this manually for centuries. What’s revolutionary is using Natural Language Processing (NLP), a field of AI that teaches computers to understand human language, to automate and scale this process.
With NLP, we can systematically analyze millions of reports, extract geologically relevant observations, and integrate that knowledge with existing structured datasets. Here’s how that works:

- Text and Image Processing: Train NLP models to scan and interpret historical reports, identifying mentions of deposit types, mineralization styles, and key geological features. Computer vision models can even process images, like geological cross-sections or drill logs.
- Location Mapping: Extract spatial references—coordinates, place names, or project boundaries—to georeference the extracted insights, placing them on a map.
- Density Mapping and Hotspots: By processing every document, we accumulate a large number of georeferenced points of interest. We can then generate a density map, where hotspot areas represent a high concentration of documents mentioning specific deposit types (like IOCGs) over time.
- Refining Insights: A hotspot doesn’t automatically mean a mineral deposit is present. Instead, geologists can review the underlying documents that generated the hotspot, manually filtering out false positives and prioritizing promising targets for further analysis.
This approach lets us unlock hidden opportunities, resurfacing forgotten exploration insights that would otherwise remain buried in archives. The result? A powerful, hybrid exploration strategy that blends structured data modeling with AI-powered text analysis—illuminating the next generation of mineral discoveries at scale.
How Do You Use NLP to Accurately Identify IOCGs Within Text?
There are several ways to use NLP to identify text related to an IOCG—a common approach would be a text classification model. Similar to how a computer vision model can distinguish between a cat and a dog, you could train a text model to classify text as IOCG or not IOCG.
However, this method is not scalable and usable by geologists. It’s a black box that lacks control and can take several hours to run for every iteration.
Instead, we do it by mimicking what a geologist would do when reading these reports—search for evidence in terms of host rocks, alteration minerals, structural processes, pathfinder minerals, structural features, and intrusions. We use AI to analyze research papers globally to build a baseline geological signature for an IOCG and then ask a geologist to refine it using their own knowledge and experience.
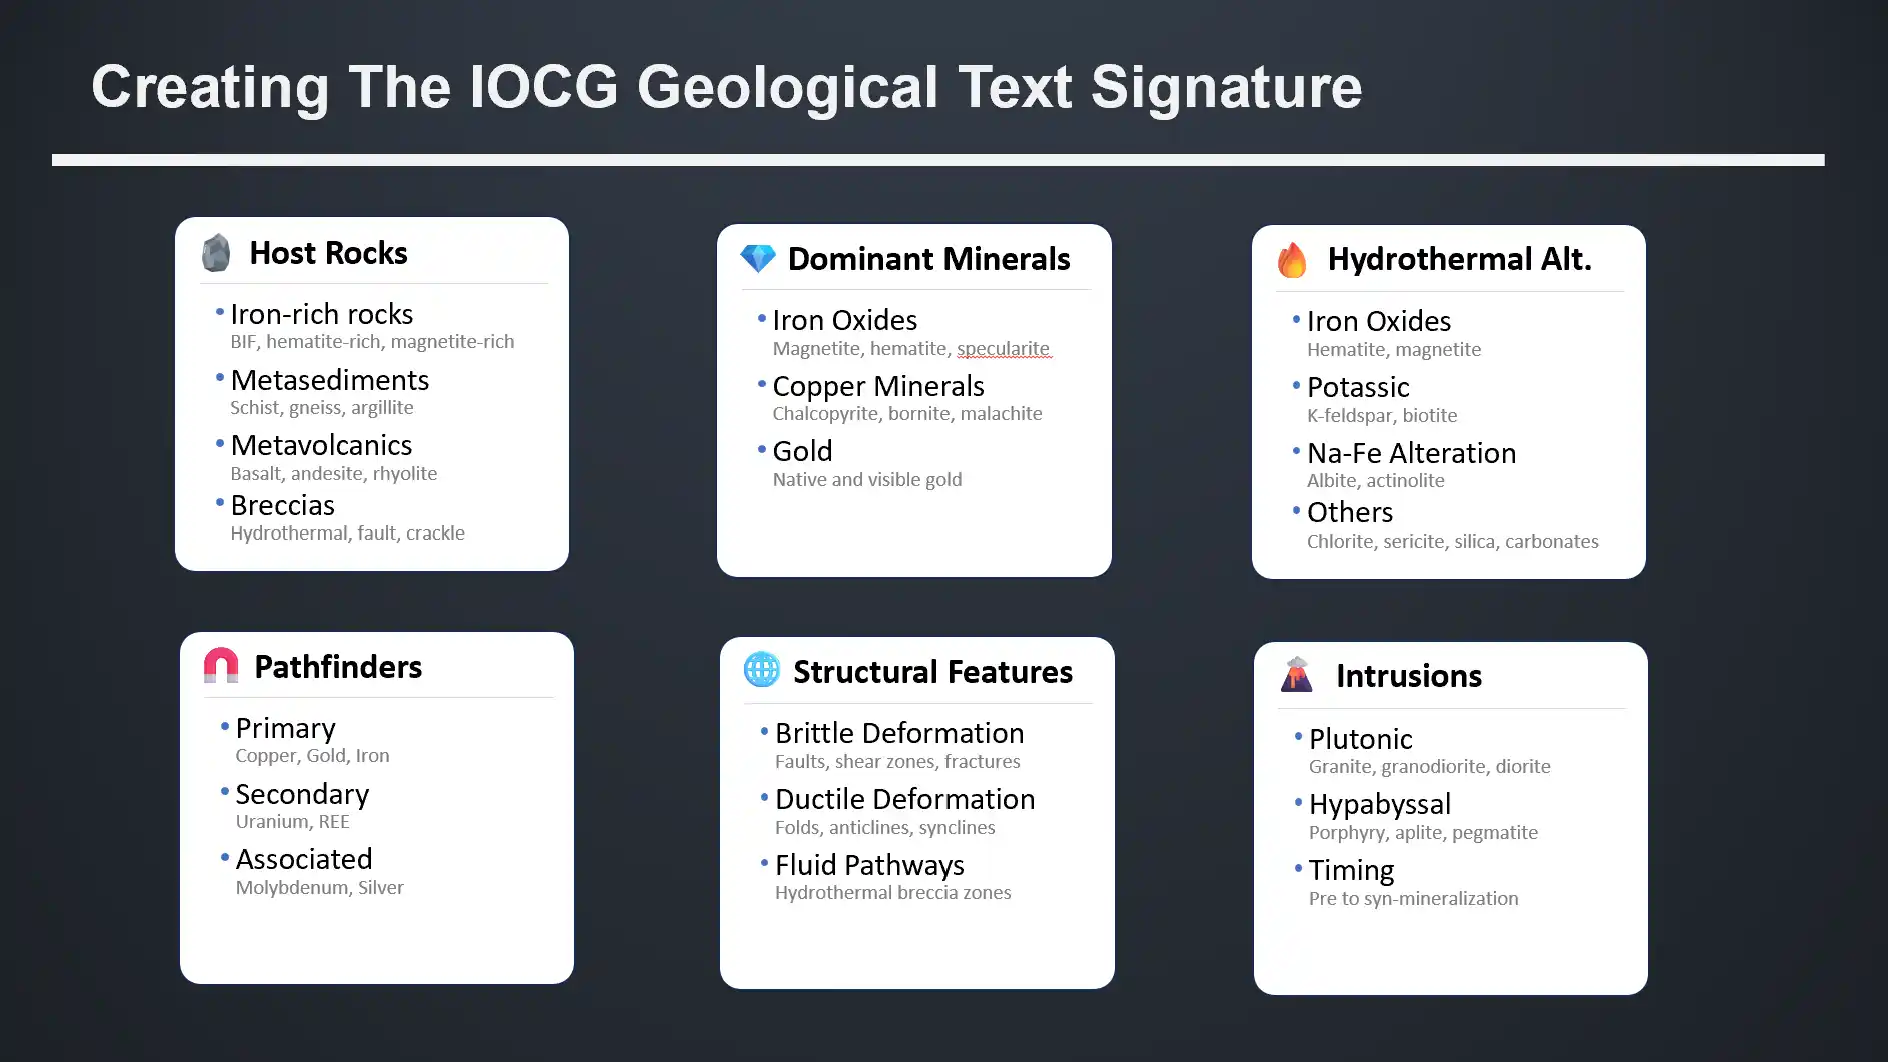
This forms our text signature describing an IOCG deposit. Just like a geologist would when they read, it needs to account for spelling errors in the documents, different ways in which past authors described geology, analyze relationships between the words, and so on. You can’t just search for these keywords.
Unlike a text classification model, we can run this on hundreds of millions of documents instantly, check the results, adjust the text signature, and repeat this process to refine our results without the overburden of retraining. Also, the geologist can modify and create signatures without needing to code.
Here is the text signature we came up with-
🔑 Unlock the hidden geological signature
Gain access to exclusive insights that could guide your next big discovery.
👉 Get the detailsVisual Test Against Australia’s Known IOCG Deposits
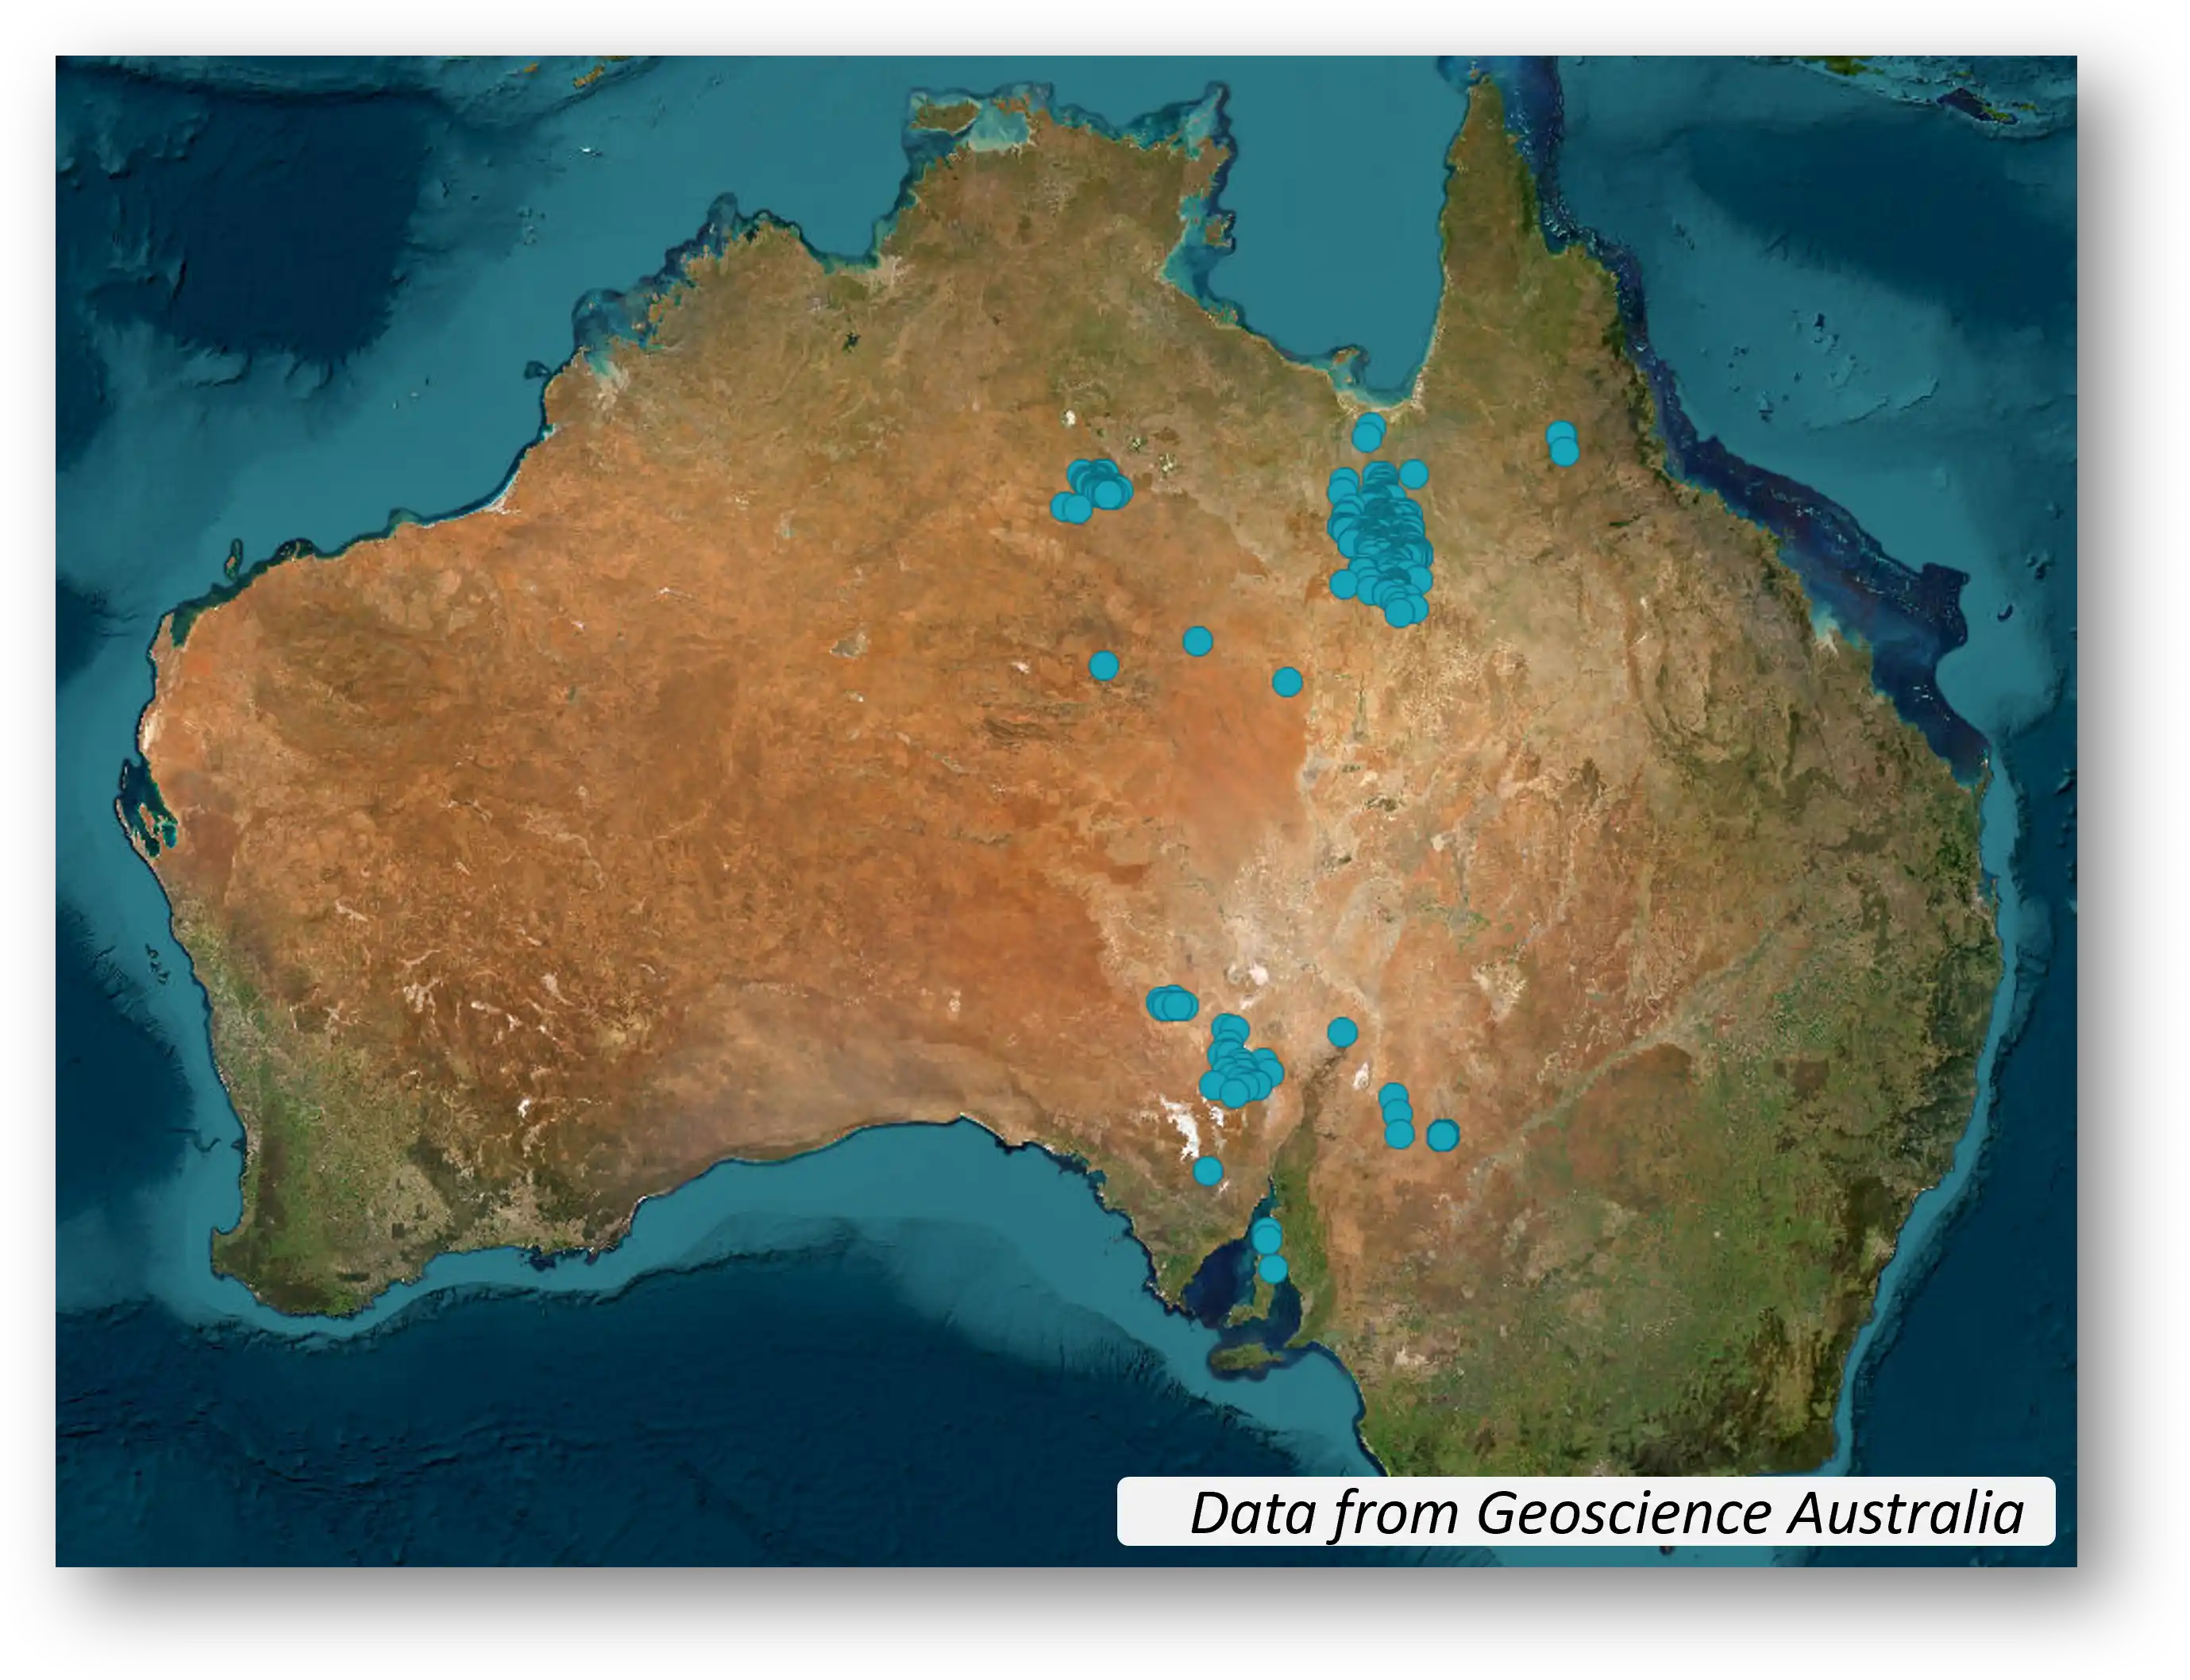
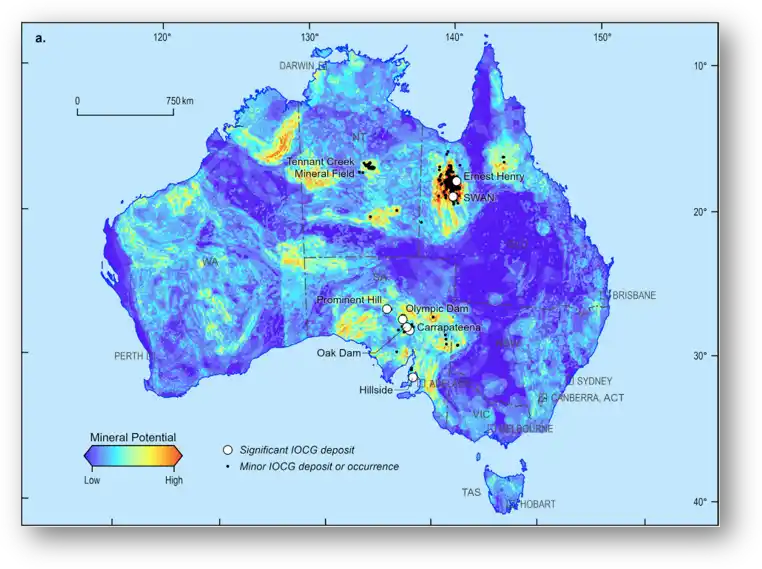
Like any predictive experiment, it’s essential to validate results against real-world data. Fortunately, Geoscience Australia has compiled a dataset of 455 confirmed IOCG deposits across the country. As noted in their research, and visible in the spatial distribution of deposits, 91.9% of these occurrences are concentrated within a few key regions: the Cloncurry district, the Gawler Craton, and the Tennant Creek region.
This clustering doesn’t affect our validation process, as we’re not using the data to train the model—only to test its accuracy. Our primary focus at this stage is identifying true positives rather than worrying about false positives. Any false positives can be filtered out in the next step, where we validate the matches against the actual contents of each document.
With the IOCG text signature developed from geological evidence, we can now run it against Australia’s open-file exploration reports, systematically scanning millions of documents to see where the signature appears in practice.
Here are the results:
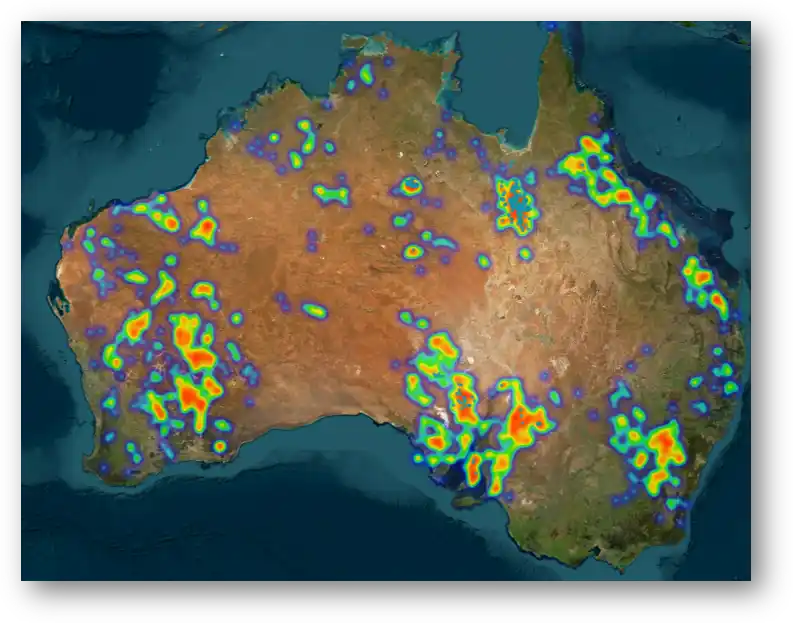
We used RadixSearch to scan all open-file reports from Western Australia, South Australia, New South Wales, Northern Territory, and Queensland. The AI identified 3,700 potential matches, which we visualized as a geospatial heatmap.
It’s important to emphasize that these hotspots don’t necessarily indicate actual IOCG deposits. Instead, they represent pages within historical reports that mention geological features associated with IOCG systems. Each result needs to be carefully validated by reviewing the original source document to eliminate false positives and confirm the relevance of the finding.
Validating Predictions Against Known Deposits
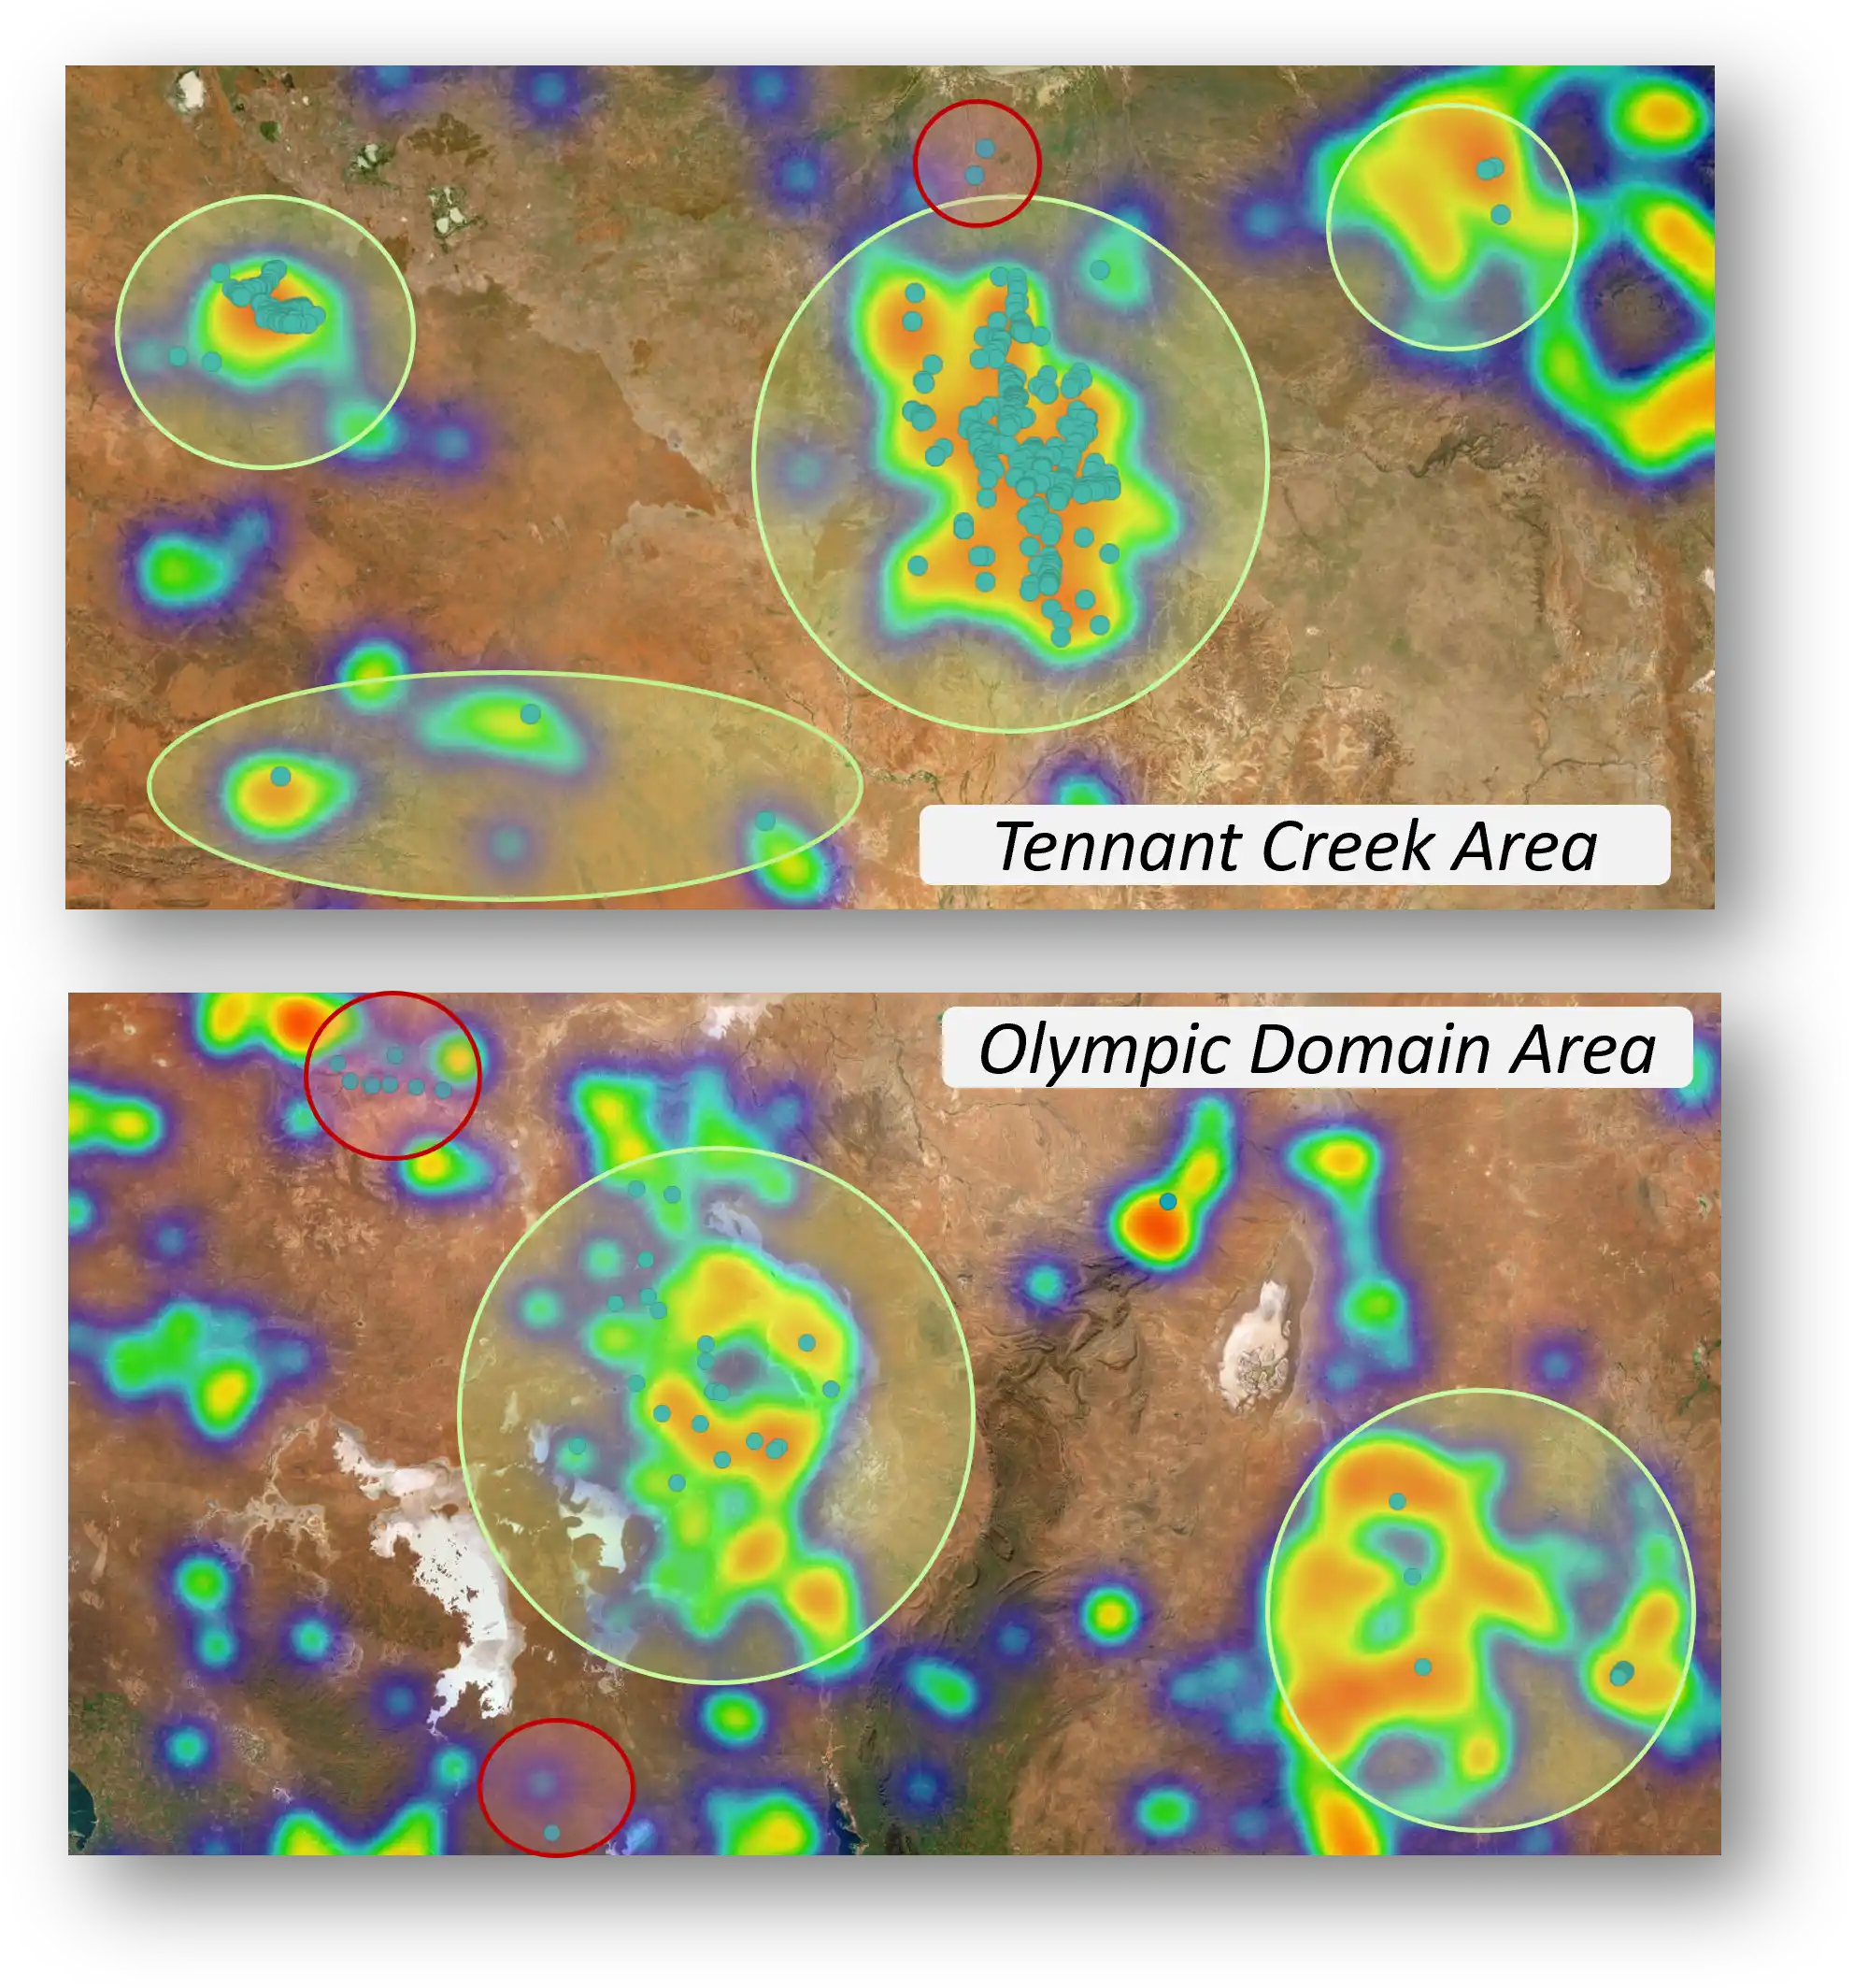
When we zoom in on clusters of known IOCG deposits, we see that many predicted hotspots (highlighted in green) align with existing deposits, while others (marked in red) do not.
This mismatch makes sense when we remember how the heatmap is generated: the hotspots represent the centroid of historical tenements, whereas the known deposits are precise point locations. Since the two datasets are inherently different, a direct comparison isn’t straightforward.
To quantify the accuracy of our predictions, we need to define a meaningful cutoff distance—essentially, how far a predicted deposit can deviate from a known deposit before being considered invalid. We’ll apply a well-established statistical technique to determine this threshold and then assess whether the result makes sense geologically.
Quantifiable Test—Random Chance Monte Carlo Simulation
To validate our model’s predictions, we ran a Monte Carlo simulation to establish a baseline for what we’d expect if our results were purely random.

Here’s how it works: for each known deposit, we randomly generate a set of points within the same geographic region. Then, we measure the distance from the deposit to the nearest random point. We repeat this process 1,000 times to create a "null distribution"—a range of distances that would occur by chance alone.
This distribution helps us define what "close" means statistically. For example, if only 1% of the random points fall within a certain distance of a known deposit, we use that distance as our cutoff (the 1st percentile).
Finally, we compare this cutoff to the actual distances between known deposits and our predicted hotspots. If many known deposits are closer to predicted points than this random cutoff, it suggests that the model is detecting meaningful geological signals—not just generating lucky guesses.
In other words, the Monte Carlo simulation lets us test whether our predictions are truly better than random chance, giving us confidence that the model is capturing real-world mineralization patterns.
Let's break it down in plain language:
What We Did:
- Known Deposits vs. Predicted Points: We have two sets of points. One is the locations of deposits we already know about. The other is the “predicted” points that came from our text analysis.
- Measuring Distance: For each known deposit, we measured how far away it is from the nearest predicted point.
- Comparing to Random Chance: To see if these distances are special, we simulated what would happen if the predicted points were just placed randomly over the area. We calculated distances in these random setups too.
- Setting a Threshold: From the random simulations, we picked a cutoff distance (about 22 kilometers) that only 1% of random cases would be closer than. In other words, if a deposit is within 22km of a predicted point, it’s unlikely to be just random luck.
Results:
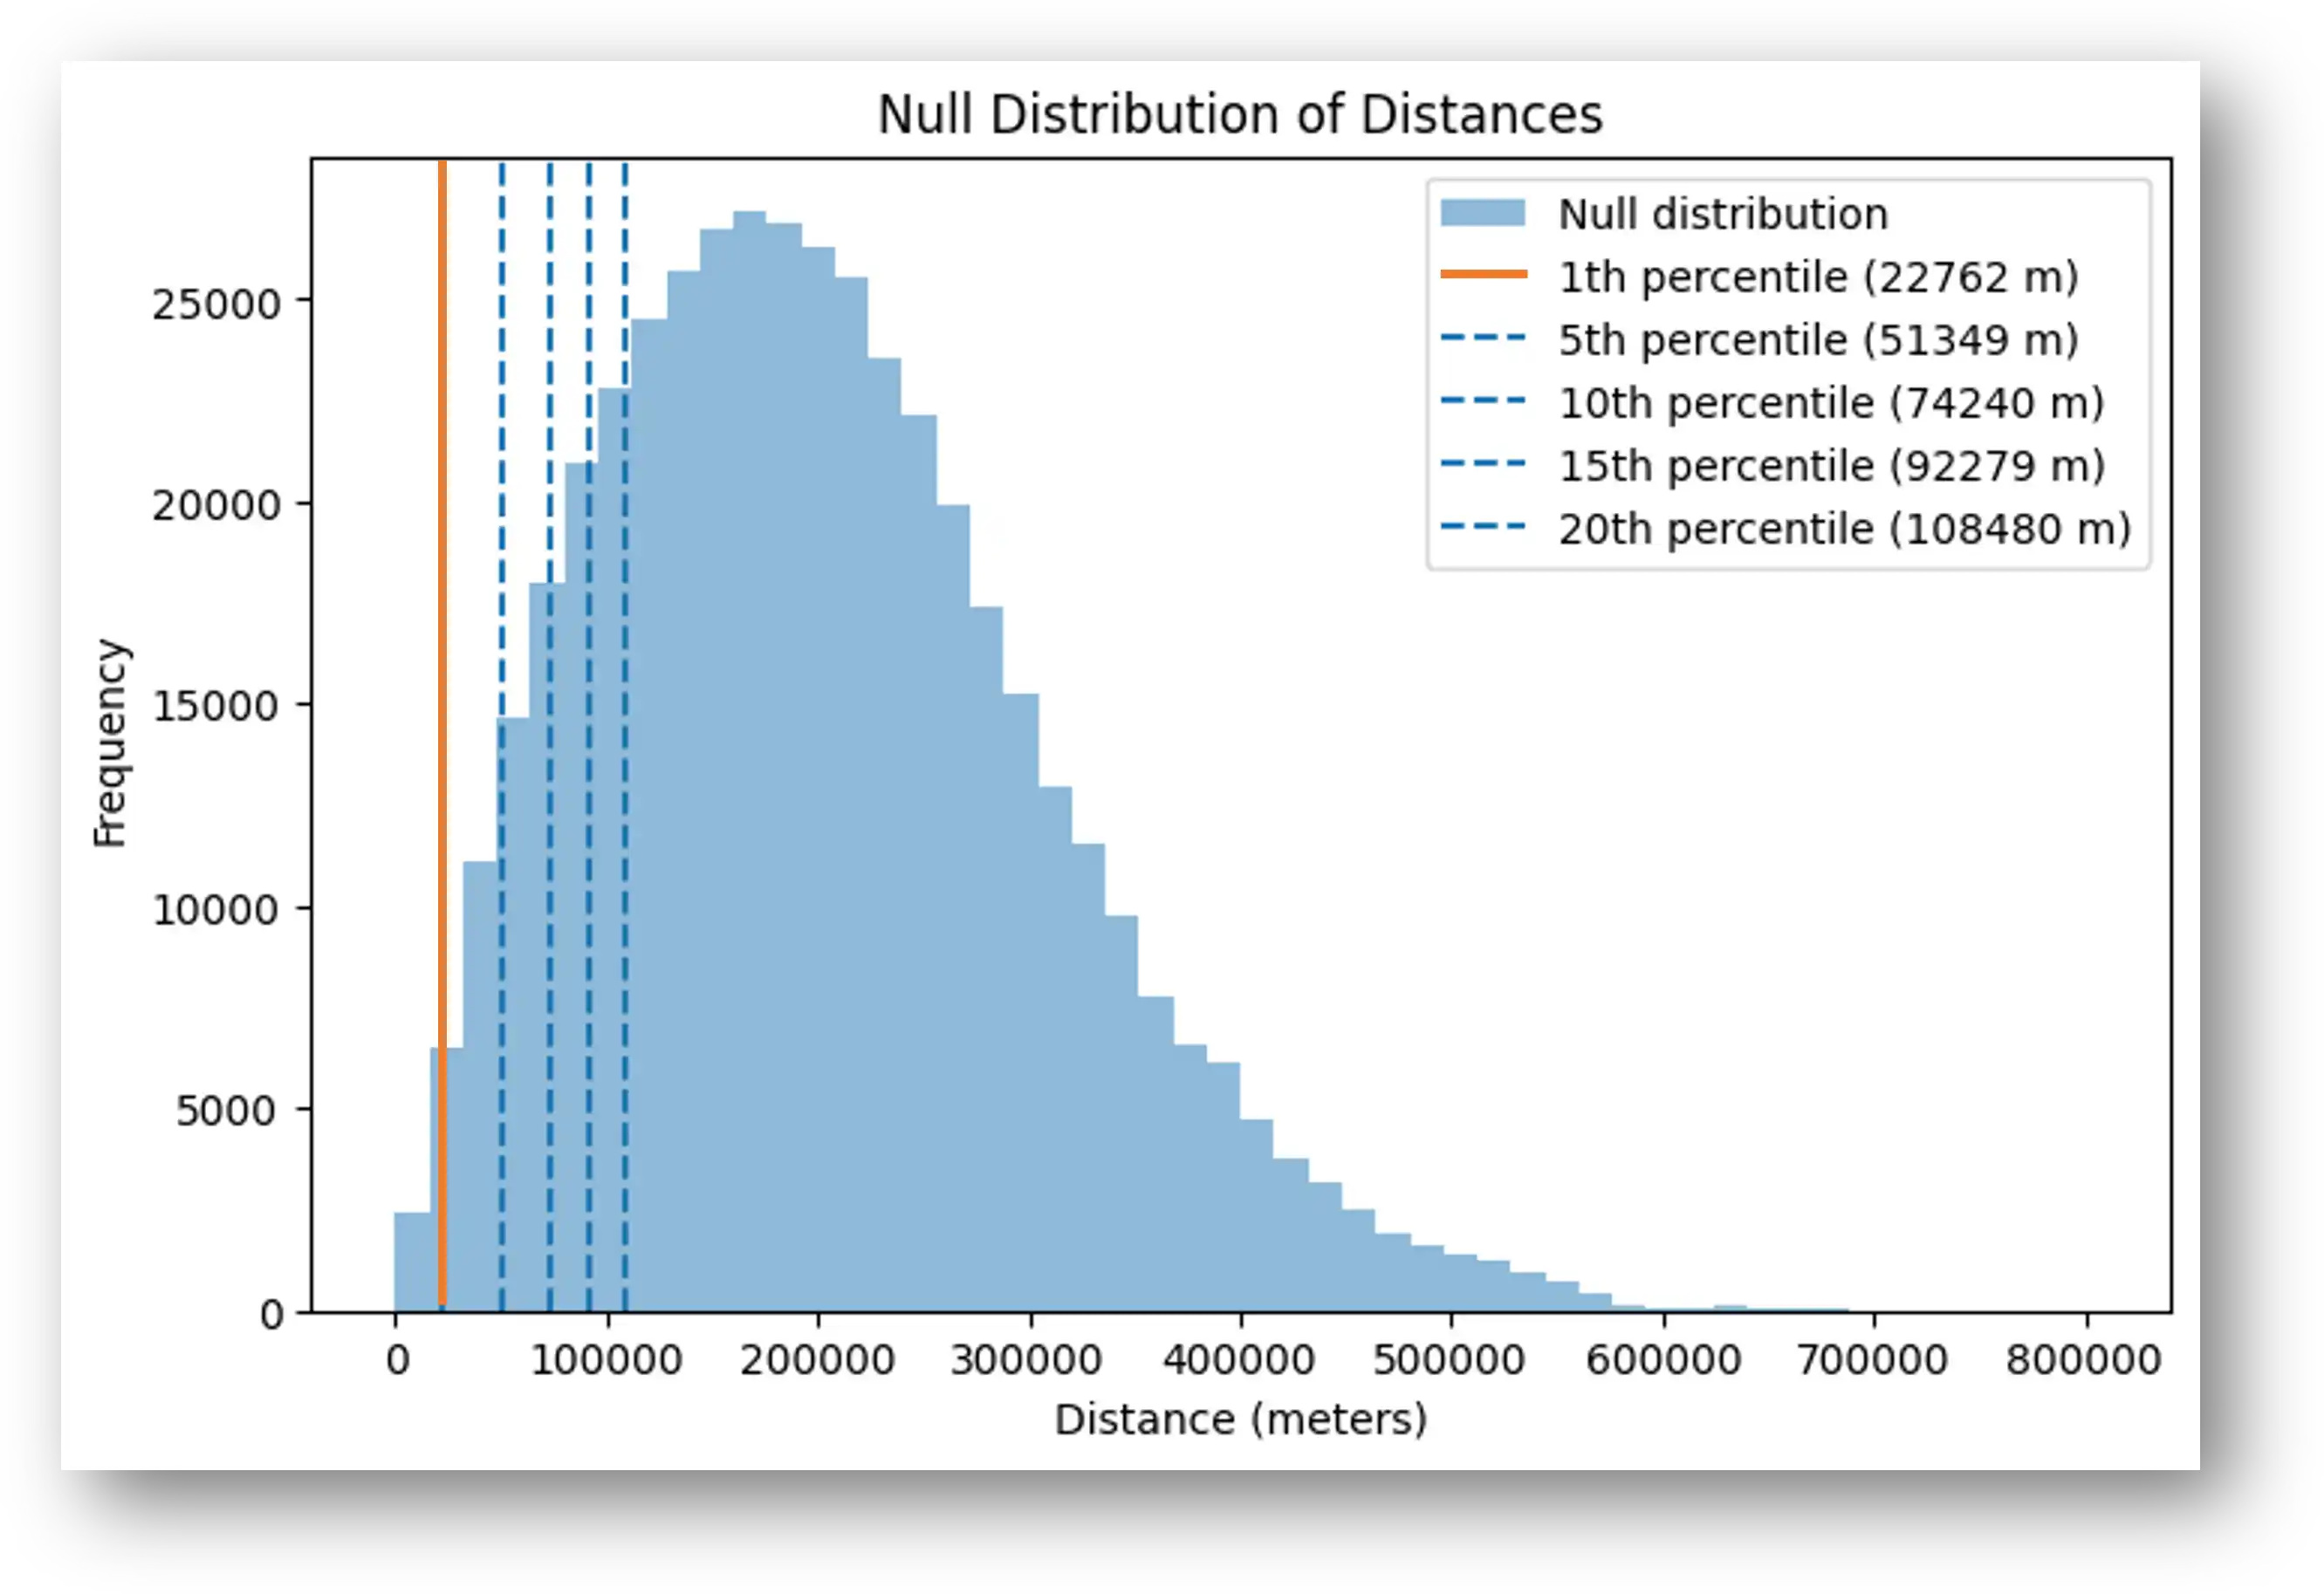
- At a very strict cutoff (1st percentile, ~22.8 km): About 98.5% of the known deposits are within that distance of a predicted point. That means even with a very tight threshold, almost all deposits are "captured."
- At a slightly looser cutoff (5th percentile, ~51.3 km): The capture rate increases to 99.8%. So, if we allow for a bit more leeway (about 51 km), almost every deposit is covered by the predicted areas.
- At even more relaxed thresholds (10th percentile and above): The capture rate hits 100%. This means that if we allow distances of 74 km or more, every known deposit is within the predicted zone.
What does this tell us?
Our text-derived signature (the predicted points) is very good at “capturing” the locations of known deposits. Even when using a very strict cutoff, almost all deposits are included, and with a slightly relaxed cutoff, they all are. This robust performance across different thresholds suggests that our method is highly reliable and not overly sensitive to the specific cutoff choice.
In short, the predicted signature aligns extremely well with the known deposits, reinforcing that our method is capturing the true pattern effectively.
What Does This Mean Geologically? Are the Results Good from a Geological Mining Perspective?
Geologically speaking, these results are very promising. Here's what they mean:
- Alignment with Known Deposits: Nearly every known IOCG deposit is within the "capture zone" of our predicted points. This suggests that the features or clues extracted from the text reports are strongly associated with actual mineralization.
- Implications for Exploration: If our text-based analysis can reliably predict areas where known deposits occur, it implies that the same approach might help identify new, previously unrecognized areas with similar geological potential. In other words, our method could be a useful screening tool for guiding exploration.
- Risk Reduction: High capture rates (98.5% to 100%) indicate that when your method flags an area, there's a very high chance it's geologically meaningful. This could help focus field efforts and reduce the risk of drilling or other expensive exploration activities.
- Geological Significance: The fact that the predicted signature aligns well with known IOCG deposits suggests that the geological factors driving the text signals—such as specific mineralogy, alteration, or structural settings—are indeed controlling deposit formation. This reinforces the geological model behind our exploration strategy.
In summary, from a mining perspective, these results are good news: they show that our approach is not only statistically robust but also geologically meaningful, supporting its potential use in exploration and discovery of new IOCG deposits.
Comparing Geoscience Australia’s IOCG Mineral Potential Map with Our Heatmap Based on Assessment Reports
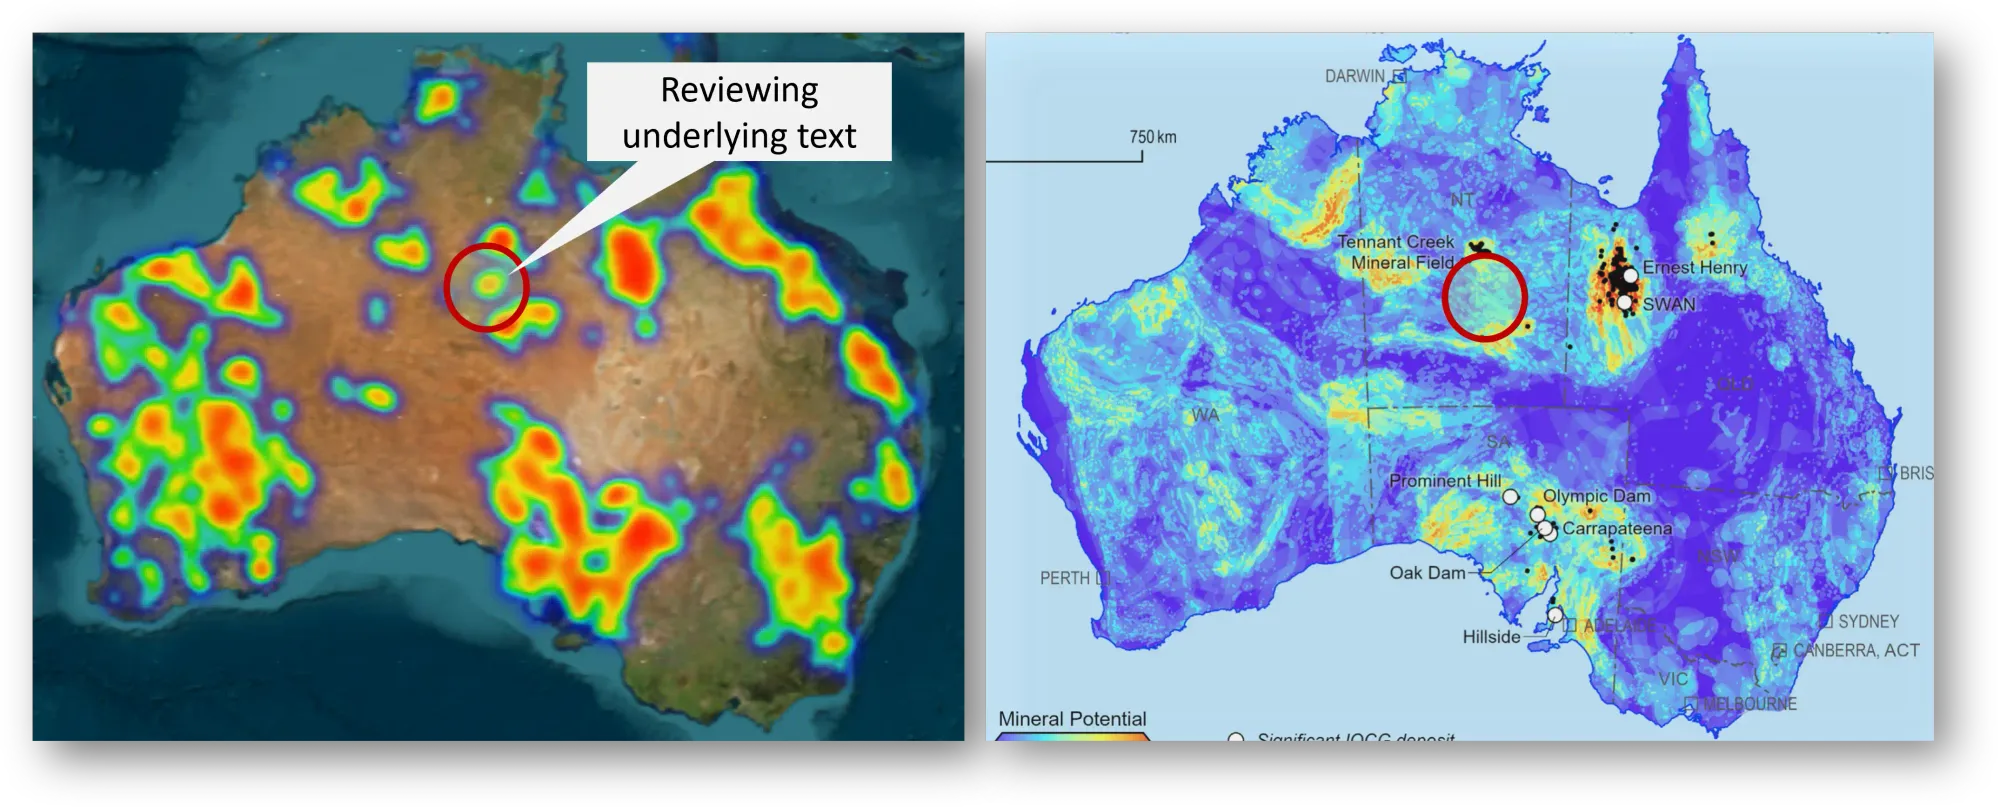
If you look at both the images or even overlay them, you would see both the hotspots in both the maps have good overlap. Note that the GA map has a color gradient (faint to bright) depending on the confidence, so it may appear that the overlap is not good.
While most of the areas do overlap, let’s dive deeper into an area where we have a prediction but GA does not and open the corresponding report page and analyze it manually to see if the text has the elements of being an IOCG or if it’s a false positive.
Analysing Text For IOCG Signatures:
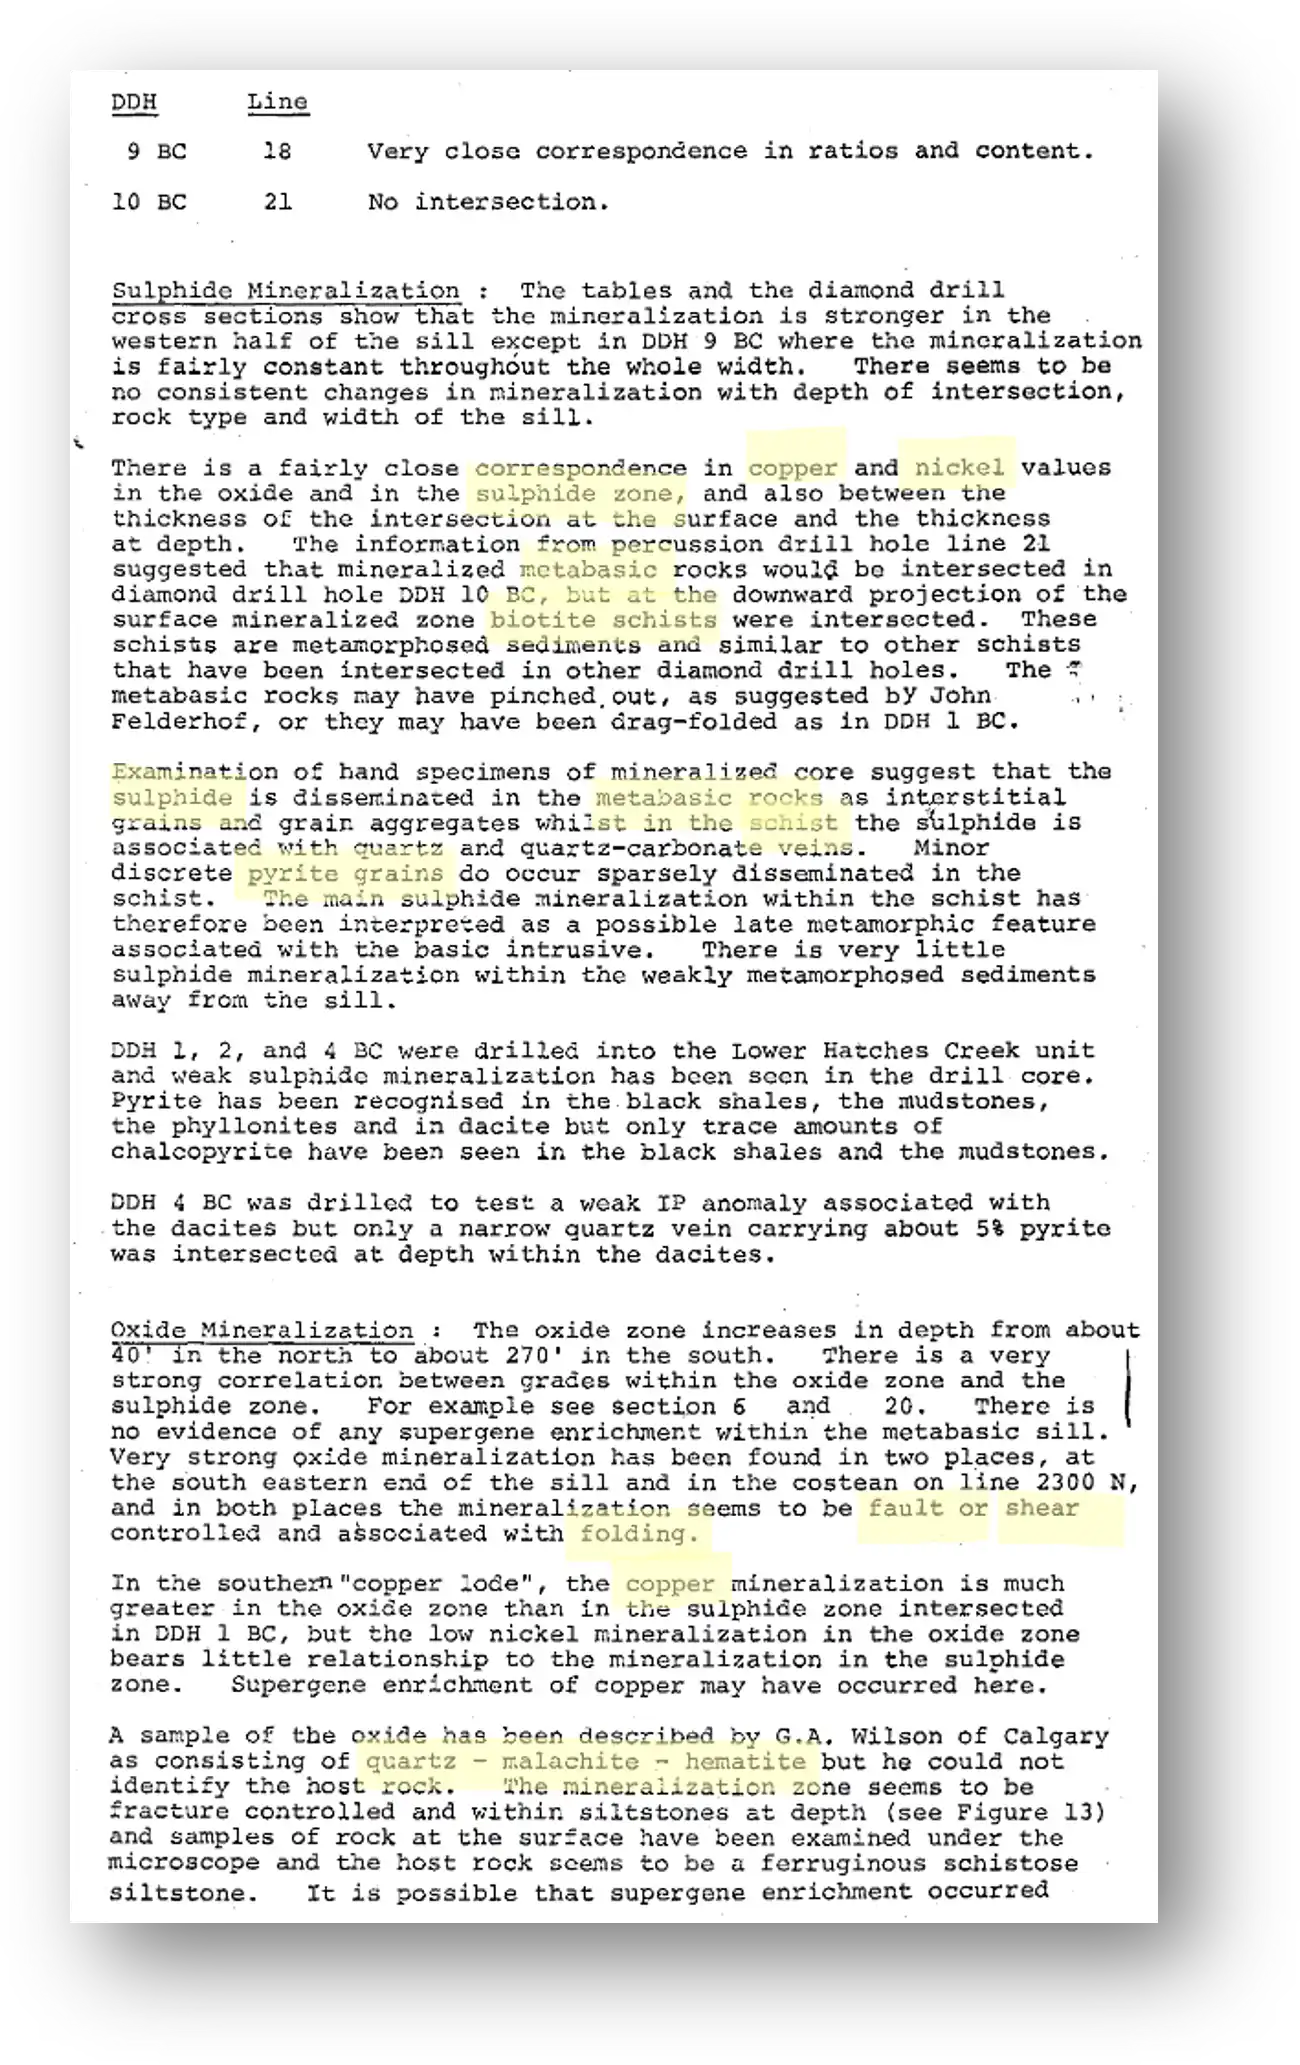
Based on the geological context and mineralization described in the report, the most probable deposit type appears to be an IOCG (Iron Oxide Copper Gold) deposit. Here’s why:
- Mineralization: The presence of chalcopyrite (a copper mineral) and malachite (a copper oxide) suggests copper mineralization, which is a hallmark of IOCG deposits. Hematite and magnetite are common in IOCG deposits and are present in the mineralization zone, further supporting the possibility of an IOCG deposit.
- Host Rocks: The presence of metabasic rocks, schists, and ferruginous siltstones suggests that the deposit could be hosted within altered rock types typically associated with IOCG deposits. These host rocks often undergo significant alteration due to hydrothermal fluids, a process common in IOCG systems.
- Alteration and Structure: The description of fracture-controlled mineralization and association with folding suggests hydrothermal alteration zones, another characteristic of IOCG deposits. The mention of quartz-carbonate veins is significant, as these are often linked to IOCG mineralization.
- Supergene Enrichment: The report suggests possible supergene enrichment in the copper zone (oxide), which is a common feature in IOCG deposits, where copper mineralization is enriched near the surface through weathering processes.
Why Not Other Deposit Types?
- Sediment-hosted Copper (SSC): The presence of malachite and weak sulphide mineralization in schist and siltstones is a characteristic of sediment-hosted copper, but there is no strong indication of the specific sedimentary conditions (like evaporitic sequences or extensive calcareous alteration) typically associated with SSC deposits.
- Porphyry Copper: Although there are signs of sulphide mineralization (chalcopyrite, pyrite) and basic intrusions, there is no clear evidence of the large-scale alteration zones or porphyry-style vein networks that are typical of porphyry copper systems.
- Epithermal Gold-Silver: The presence of quartz-carbonate veins does suggest the possibility of epithermal mineralization, but there is no indication of precious metal enrichment (gold/silver), which is a key feature of epithermal systems.
- Skarn: Although the alteration minerals (biotite, actinolite) might point to a skarn system, there is no direct evidence of calc-silicate rocks or contact zones with intrusions, which are typical of skarn deposits.
The most probable deposit type based on the available data is an IOCG deposit due to the combination of copper and iron mineralization (chalcopyrite, hematite), alteration zones, and the geological setting (metamorphic rocks, hydrothermal breccia, fault zones). The presence of supergene enrichment and the mention of fault/shear zones further support this hypothesis.
Can This Same Signature Be Used in Other Regions?
Now that the IOCG text signature has been rigorously tested and validated in Australia, the next logical step is to apply it to other regions. This approach allows us to leverage the insights gained from one region to identify potential IOCG deposits elsewhere. For this purpose, we tested the same signature on Ontario’s GeologyOntario assessment reports, a rich repository of historical exploration data.
Applying the Signature to Ontario’s GeologyOntario Reports
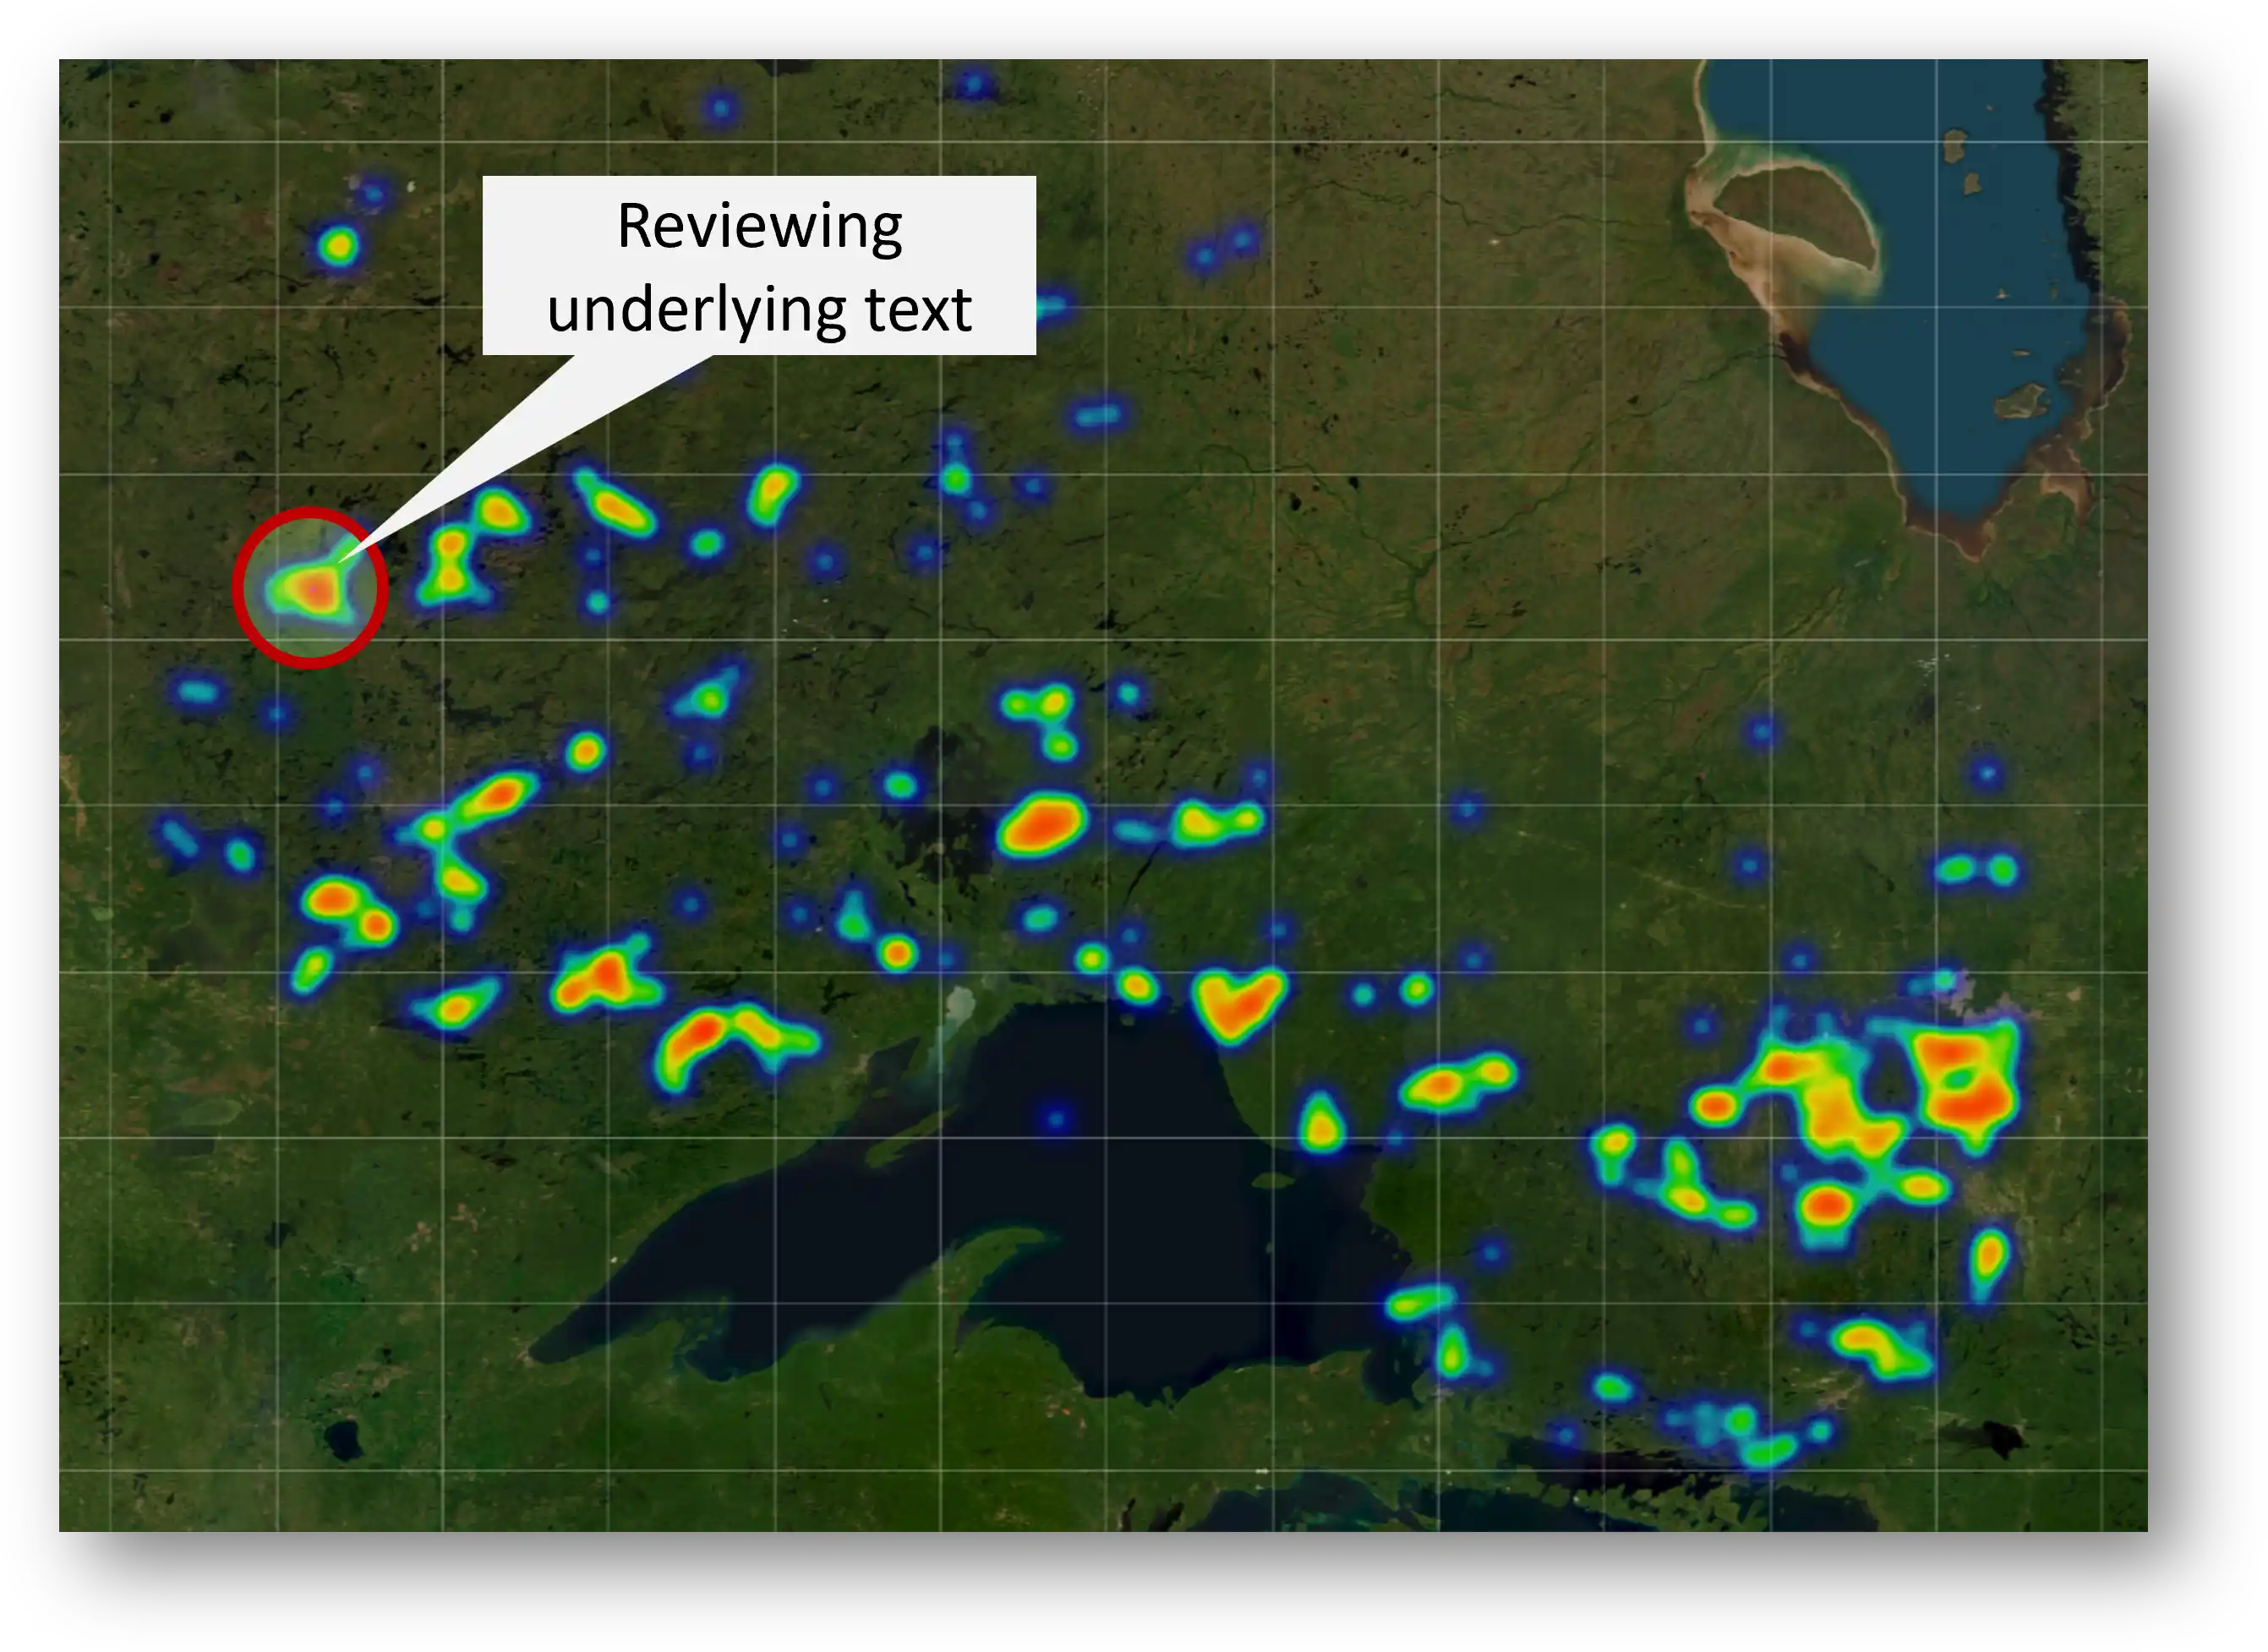
When we applied the IOCG text signature to Ontario’s assessment reports, we identified 1,769 hits—potential indications of IOCG deposits. However, as with the Australian data, not all of these hits will correspond to actual deposits. To validate the results, we selected a specific area (circled in red on the heatmap) and manually interpreted the text in the corresponding report.
Interpreting the Text: Is This an IOCG Deposit?
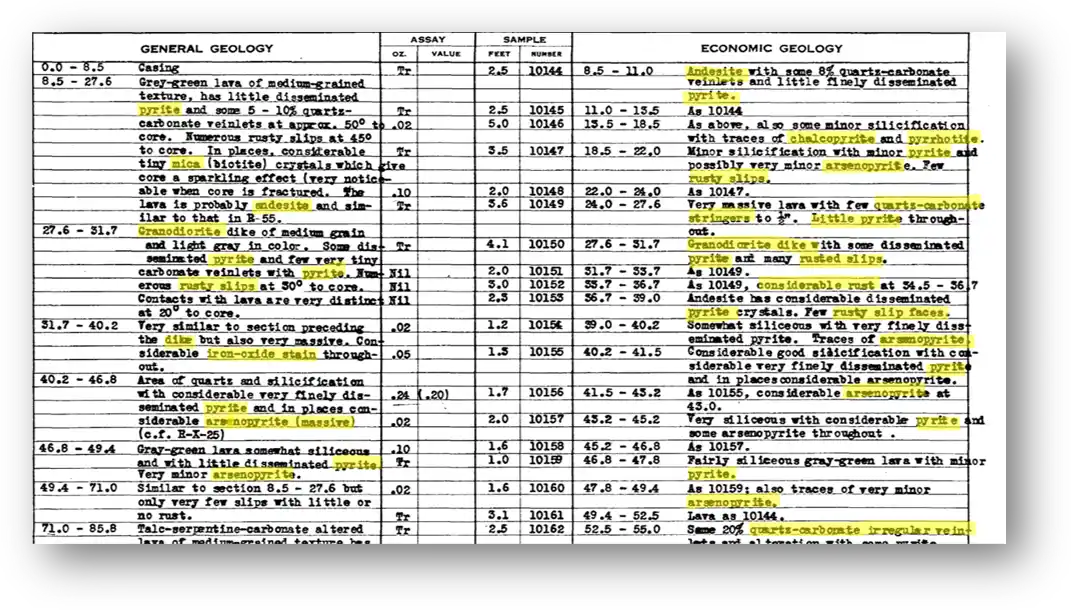
Based on the geological details provided in the report, there are several elements that suggest this could indeed be an IOCG (Iron Oxide Copper Gold) deposit. While further exploration and assays would be required for confirmation, here are the key features supporting this possibility:
Key Features Supporting IOCG Potential:
- Mineralization:
- Disseminated Pyrite: Pyrite is commonly associated with IOCG deposits, and its presence in significant amounts is noted in various sections of the core.
- Arsenopyrite: This mineral is often found in IOCG systems, indicating possible hydrothermal activity and gold potential. Arsenopyrite is frequently linked to gold in these deposits.
- Chalcopyrite: Traces of chalcopyrite, a primary copper mineral, are observed in certain sections, further supporting the IOCG hypothesis.
- Quartz-Carbonate Veins: These veins are characteristic of IOCG systems, often forming in alteration zones created by hydrothermal fluids.
- Geological Context:
- Alteration: The report mentions considerable alteration, including silicification and talc-serpentine-carbonate alteration, which are common features of IOCG systems. Talc and serpentine alteration can indicate intense hydrothermal activity typical of IOCG deposits.
- Granodiorite Dike: The presence of a granodiorite dike is significant. IOCG deposits are often associated with intrusive bodies such as granite and granodiorite, which serve as heat sources for mineralizing fluids.
- Host Rocks:
- The presence of andesite and gray-green lavas, as well as other volcanic rocks, is consistent with the types of rocks often found in IOCG deposits. These rocks are susceptible to hydrothermal alteration, a key characteristic of IOCG systems.
- Rusty Slips and Oxidation:
- The report mentions rusty slips and considerable iron oxide in the mineralized zones, indicating oxidation processes often associated with the upper levels of IOCG deposits.
- Other Observations:
- Economic Minerals: The report notes traces of chalcopyrite and minor pyrrhotite, both of which suggest copper and iron mineralization—essential components of IOCG deposits.
- Arsenopyrite: The presence of arsenopyrite, especially in significant amounts, supports the potential for gold mineralization, which is often associated with IOCG deposits.
Given the presence of copper-bearing minerals like chalcopyrite, pyrite, arsenopyrite, quartz-carbonate veins, and significant alteration types, it is reasonable to suggest that this could be an IOCG deposit. However, further exploration, drilling, and assays would be necessary to confirm the extent of mineralization and whether the deposit aligns with typical IOCG characteristics.
Integration Within the Exploration Workflow and Other ML Studies
The heatmap generated from this analysis can be exported into any GIS suite, allowing explorers to compare the insights derived from unstructured data sources with their own databases of drill hole and potential field information. This integration is particularly valuable for companies that use S&P Global’s datasets on mining companies’ production and financial numbers to identify promising projects. By overlaying the Radixplore heatmap on top of S&P Global’s extracted projects, companies can integrate geological insights into their financial and operational analyses, creating a more holistic view of exploration potential.
Quantified Heatmap Input:
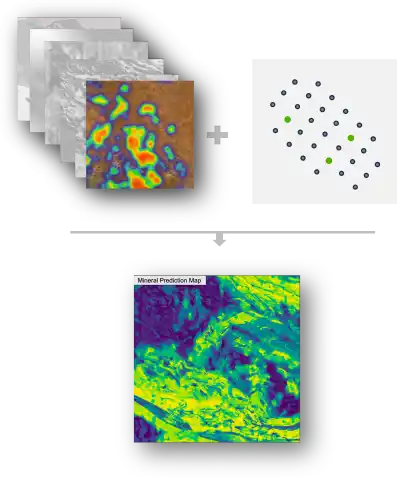
Our heatmap quantifies deposit-related discussions from historical text reports as a geospatial density layer. Hotter spots indicate areas with a higher concentration of relevant documents over time, serving as a valuable input into Geoscience Australia (GA)-style mineral prospectivity models. This approach aggregates insights from thousands of explorers over centuries, providing a rich dataset that can seamlessly feed into predictive models used by companies like VRIFY and other consultancies.
Data Quality & Gap Identification:
One of the key benefits of this method is its ability to identify missing or questionable historical geochemical data. By systematically analyzing unstructured data, we can ensure that mineral prospectivity maps are based on the most complete and accurate dataset possible. This not only improves the reliability of predictive models but also helps explorers prioritize areas for further data collection and validation.
Conclusion: Unlocking the Future of Mineral Exploration with AI and Predictive Modeling
The integration of predictive modeling and AI-driven unstructured data analysis is revolutionizing the mining industry. By combining traditional geological expertise with cutting-edge technology, we’re not only accelerating the discovery of mineral deposits but also reducing exploration risks and costs. The ability to analyze structured data like geophysical surveys and unstructured data such as historical reports opens up a world of possibilities for explorers, enabling them to uncover hidden opportunities that were once buried in archives.
From Australia’s IOCG deposits to Ontario’s geological potential, the results speak for themselves. Our AI-powered approach has demonstrated its ability to identify high-potential areas with remarkable accuracy, providing explorers with actionable insights that can guide their next steps. Whether you’re a mining company, a consultancy, or a government geological survey, this technology offers a competitive edge in the race to discover the next generation of economically viable deposits.
But this is just the beginning. The future of mineral exploration lies in the seamless integration of structured and unstructured data, powered by AI, to create a comprehensive understanding of the Earth’s mineral potential. The question is: Are you ready to embrace this future?
Transform Your Exploration Strategy Today!
If you’re ready to take your mineral exploration efforts to the next level, it’s time to leverage the power of AI-driven predictive modeling and unstructured data analysis. Here’s how you can get started:
- Try RadiXplore for Free: See firsthand how our AI-powered tools can transform your exploration workflow.
- Schedule a Consultation: Speak with our team of experts to discuss your specific exploration challenges and goals. We’ll work with you to develop a customized solution that fits your needs.
- Join the Revolution: Don’t get left behind. Partner with us to integrate AI and predictive modeling into your exploration strategy. Together, we can redefine the future of mineral discovery.
The next big discovery could be just one dataset away. Are you ready to find it?