Australian Mining Tenement Intelligence: Q1 2026 Review & Spatial Analysis
Q1 2026 Australian mining tenement activity reveals a shift from land grabbing to targeted exploration. Discover where capital is flowing, which regions are most contested, and how to identify high-potential gold and lithium targets using strategic tenure intelligence.

Date: 25 March 2026
Scope: National Australia Mining Tenements
Classification: Commercial / Competitor Intelligence
EXECUTIVE SUMMARY: The Q1 Transition
The first quarter of 2026 saw massive district-scale consolidation, primarily in Western Australia. Companies like Archer X Pty Ltd (>5,600 km²) and CGM (South Yilgarn) (>3,000 km²) locked up province-scale acreage.
However, this week's data reveals the market shifting from "Land Grabbing" to "Execution." Activity has abruptly pivoted to targeted strategic moves in South Australia (National Net Change +5), while our algorithms detected extreme, multi-party pegging wars in WA's Yandal and Coolgardie belts-areas recently validated by massive corporate funding and drill announcements. The dust has settled; the statutory expenditure phase begins now.
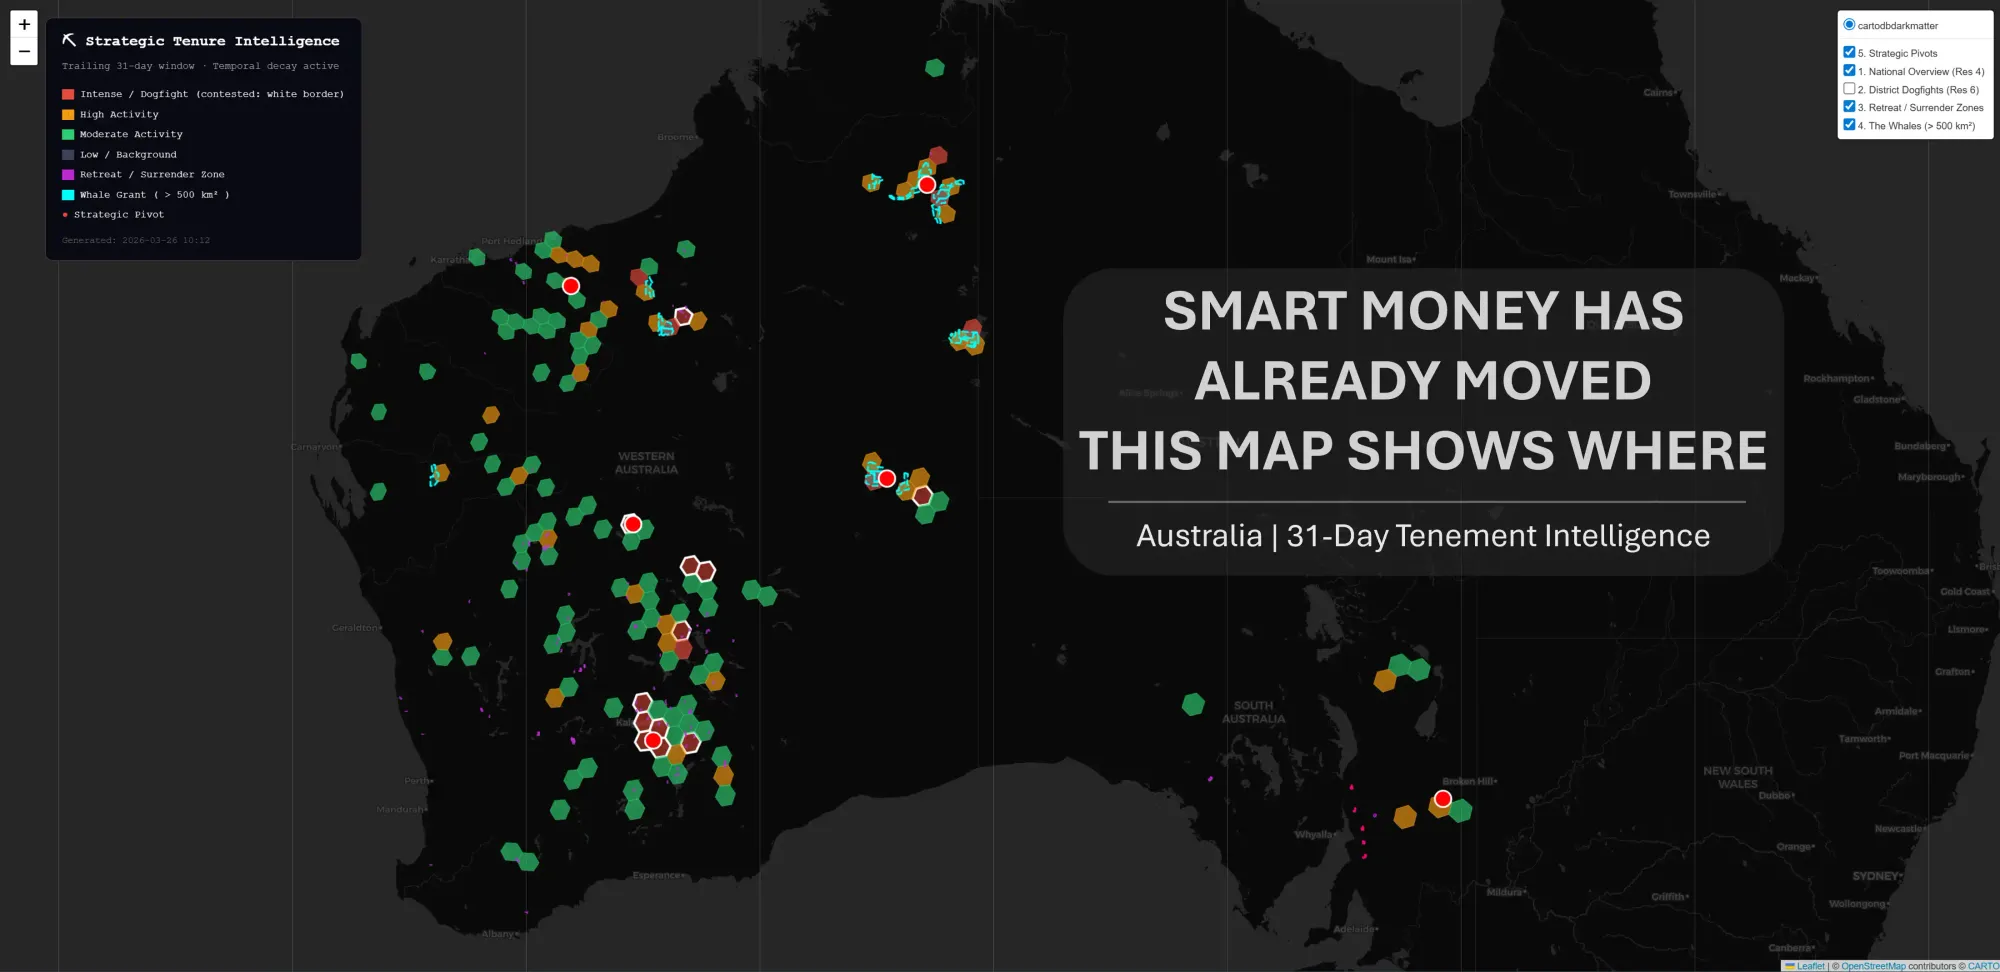
Live Intelligence: Strategic Tenure Map
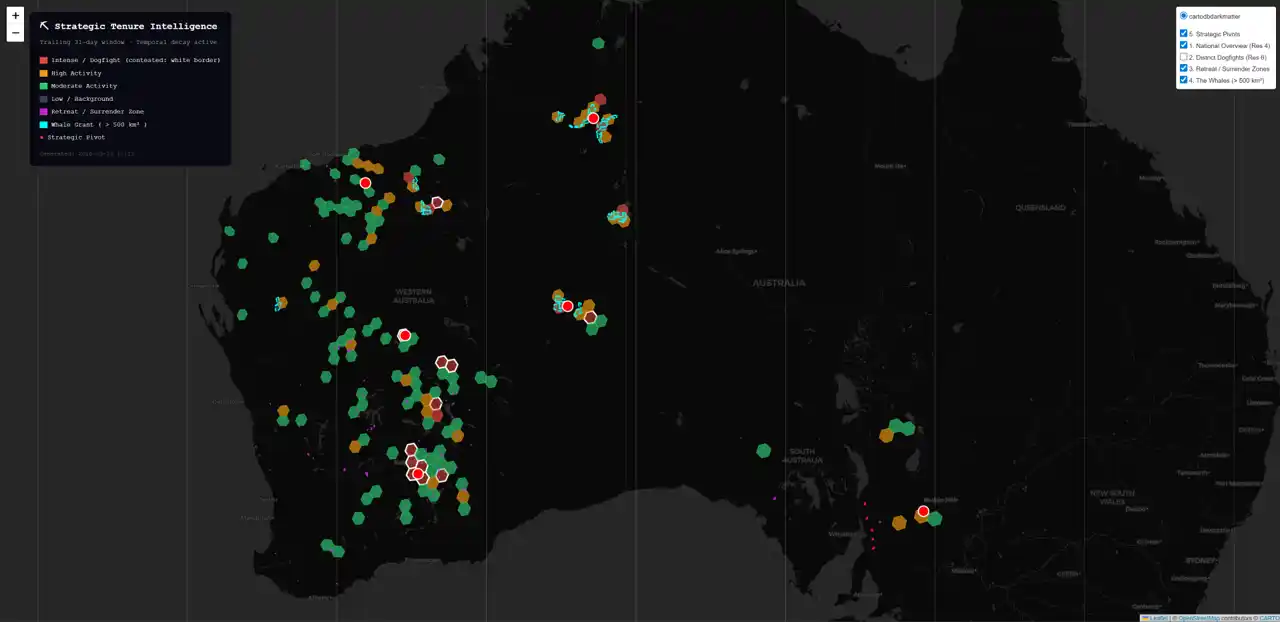
How to Read the Strategic Tenure Intelligence Map
Detailed step-by-step tutorial at the end of this article.
This map is a live companion to the written briefing below. Every insight in the text has a spatial counterpart on the map. Use them together.
The map covers the last 31 days of tenement activity, but not all activity is weighted equally-grants from this week burn brighter than grants from a month ago. Faded activity is context; bright activity is signal.
Toggle the 5 layers using the control panel (top right) to uncover the narrative:
- Layer 1: National Overview (Hexagonal Grid, Res 4)
Australia is divided into large 300km hexagonal cells coloured by the intensity of new tenement grants. Dark slate = Empty. Green = Moderate. Amber = High. Red = Intense activity. White hex borders indicate a contested zone (3+ distinct companies pegging). A red hex with a white border is the single most important signal on this map. - Layer 2: District Dogfights (Hexagonal Grid, Res 6)
Zoom into a 15km resolution. A cluster of red, white-bordered hexes sitting adjacently tells you the contest is concentrated on a specific structural corridor. The surrounding green cells represent what is still available and strategically adjacent-your rapidly closing opportunity window. - Layer 3: Retreat / Surrender Zones (Purple/Magenta Hexes)
Areas relinquished in the last 31 days. Soft violet = minor retreat. Hot pink/Dashed borders = major, coordinated surrender. Use this to spot distressed sellers, fresh acquisition opportunities, or "technical red flags" where sophisticated money has drilled and walked away. - Layer 4: The Whales (Cyan Outlines)
Individual tenement polygons exceeding 500 km². A single cyan outline covering a Belgian-sized area represents a massive strategic bet. When cyan polygons overlap with red activity hexes, a province-scale consolidation thesis is playing out in real-time. - Layer 5: Strategic Pivots (Red Markers)
Manually verified intelligence markers pinned to the precise geographic centroid of the projects called out in this briefing. Click for the full intelligence note, including project names, ASX codes, and strategic context.
1. Insights for Exploration Geologists
Goal: Identify emerging districts, competitor focus, and validated geological trends.
A. The "Wiluna Dogfight" (WA - Yandal Greenstone Belt)
- The Signal: Extreme congestion detected across three adjacent grids (GRID_438_207, GRID_439_206, GRID_437_208).
- The Combatants: 1 Wiluna SG51 Perth, Albion Resources, Manda Resources, and Yandal Resources are tightly locked in a pegging war, overlapping on dozens of tenements.
- The Geological Read: When four active explorers swarm a specific corridor, it signals a major structural target. Context: This aligns precisely with Yandal Resources (ASX: YRL) commencing a major 30,000m drill program across its Ironstone Well-Barwidgee (IWB) Gold Project.
B. The Gold/Lithium Nexus (WA - Grid 450_155 / Bullabulling)
- The Signal: 5 distinct holders are fighting tooth-and-nail over just 88 km² of ground.
- The Combatants: Bullabulling Operations, Forrestania Resources, Lithium Resources Investments, Mandilla Gold, and Spargoville Minerals.
- The Geological Read: The corporate names tell the story-Gold explorers and Lithium explorers are competing for the exact same structural corridors. Context: This area sits near the Bullabulling Gold Project, advancing rapidly under Minerals 260 after securing A$220m funding from Franco-Nevada in Feb 2026. This massive capital injection has supercharged the perceived value of all surrounding tenure.
C. The South Australian Pivot: Magnetite's Gold Play
- The Signal: Magnetite Mines Limited (ASX: MGT) just secured 371 km² in SA (EL 7106).
- The Geological Read: While the company name suggests iron ore, corporate context confirms this is EL 7106 (Manna Hill Gold Project). Located ~100 km from their Razorback Iron Ore Project, this ground contains historic small-scale gold workings. This signals a strategic pivot by an established player into underexplored multi-commodity systems.
2. Corporate Finance & Business Development
Goal: Identify M&A targets, capital raise candidates, and JV partners.
A. The "New Whales" of Q1 (Capital Raise Targets)
The late Feb/early March data reveals the emergence of massive new land bankers in Western Australia. These entities have swallowed province-scale packages and will urgently need capital to fund their new statutory expenditure commitments:
- Archer X Pty Ltd: 12 Tenements / 5,605 km² (Ranked #1 Elite)
- CGM (South Yilgarn) Pty Ltd: 7 Tenements / 3,076 km² (Ranked #2 Elite)
- Muccanabout Pty Ltd: 6 Tenements / 2,367 km²
B. Consolidation Opportunities in Contested Grids
The heavily contested grids in WA (visible on the map as white-bordered red hexes) represent highly fragmented ownership over premium geological real estate-especially near the newly funded Bullabulling project. For mid-tiers looking for M&A, these hotspots are ripe for corporate consolidation. Pitch a roll-up strategy to unify fragmented grids before impending drill results drive up acquisition premiums.
3. Mining Services & Logistics
Goal: Who has fresh money to spend and immediate work requirements?
A. Immediate Leads (The "Fresh Ink" & Funded Plays)
- Yandal Resources (ASX: YRL): With 30,000m of drilling slated for the IWB project in the Yandal Greenstone belt, they are the #1 target for drilling contractors, camp logistics, and assay labs in the region.
- Magnetite Mines Limited (ASX: MGT): Having just been granted EL 7106 (Manna Hill) in SA this week, they will need immediate heritage surveys, environmental consulting, and desktop geology to kick off early-stage gold exploration.
- Tri-Star Minerals Pty Ltd (SA): Granted EL 7107 (128 km²) this week.
- Tarcoola 2 Pty Ltd (SA): Granted EL 7108 (91 km²) this week.
B. The "Q1 Backlog" Play (WA)
Between Feb 25 and March 11, over 16,000 km² of new ground was added in WA. That ink is now drying, and the clock is ticking on Year 1 expenditure.
- Manda Resources Pty Ltd: Secured 17 new tenements. Pitch tenement management, bulk soil sampling crews, and early-stage reconnaissance mapping.
- FMG Pilbara Pty Ltd: Secured 13 new tenements (~133 km²). Fortescue is actively filling pipeline targets. Pitch premium remote sensing, airborne geophysics, and drone survey packages.
C. Tenement Management & Compliance Warning
While new pegs slowed down this week, WA and SA saw a spike in "Modified Tenements" (14 total this week). The end of Q1 brings compliance reporting, rent payments, and partial relinquishment deadlines. Tenement management firms should run campaigns targeting junior explorers, highlighting the risk of losing their Q1 land-grabs to compliance errors.
Data Source: Public mining tenement registries, aggregated and analyzed via proprietary spatial algorithms. Disclaimer: This report does not constitute financial advice. Always verify tenure status with the relevant Department of Mines.
HOW TO READ THE STRATEGIC TENURE INTELLIGENCE MAP - Detailed Tutorial
This map is a live companion to the written briefing. Every insight in the text above has a spatial counterpart on the map. Use them together.
GETTING STARTED
The map loads with all layers active. Use the layer control panel (top right) to toggle individual layers on and off. The most powerful workflow is to start with the National Overview to identify which districts are hot, then zoom into those districts and switch to District Dogfights to see exactly who is fighting and over what ground.
The map covers the last 31 days of tenement activity, but not all activity is weighted equally - grants from this week burn brighter than grants from a month ago. This is intentional. Faded activity is context; bright activity is signal.
LAYER 1 - NATIONAL OVERVIEW (Hexagonal Grid, Res 4)
What you are seeing: Australia divided into large hexagonal cells approximately 300km across. Each hex is coloured by the intensity of new tenement grant activity within it over the last 31 days.
The colour scale:
- Dark slate / invisible - No meaningful activity. Empty ground or no recent movement.
- Green - Moderate activity. One or two companies quietly building positions. Early-stage district interest.
- Amber - High activity. Multiple companies moving in the same district. The market has noticed something.
- Red - Intense activity. This district is on fire. Use this as your starting point for any further investigation.
White hex borders indicate a contested zone - three or more distinct companies have pegged ground within that cell in the last 31 days. A red hex with a white border is the single most important signal on this map. It means the market has already made a judgement about that ground and multiple well-resourced parties agree.
How to use it: Scan the national view first. Identify the red and amber clusters. In this week's briefing, the dense red concentration in the southern Goldfields of WA and the activity cluster near the Yandal Greenstone Belt are your primary focus areas. Everything else on the map is context for those two anchors.
Hover over any hex to see the region, number of new tenements, number of competing companies, total area pegged, intensity score, the date of the most recent grant, and the lead company by tenement count.
LAYER 2 - DISTRICT DOGFIGHTS (Hexagonal Grid, Res 6)
What you are seeing: The same activity data rendered at a finer resolution - hexagonal cells approximately 15km across. Toggle this layer on when you have already identified a hot district in Layer 1 and want to understand the street-level competition.
How to use it: Zoom into the southern Goldfields cluster visible in the National Overview. Switch on District Dogfights and switch off National Overview to reduce visual clutter. You will now see the individual 15km cells where pegging wars are occurring. A cluster of red white-bordered hexes sitting adjacently tells you the contest is concentrated on a specific structural corridor, not spread randomly across a district.
The critical read: Look for the pattern of red hexes surrounded by green hexes. The red cells are where the fight is happening right now. The surrounding green cells are what is still available and strategically adjacent. If you have existing ground in those green cells, or if you are evaluating entry into the district, those green fringe hexes are your opportunity window - likely closing within weeks as near-ology pegging follows validated ground.
Hover over any micro hex to see the full breakdown: which companies are active, their tenement counts, area held, percentage share of that cell, and a recency score indicating how fresh their activity is.
This week's key dogfight cells - the Yandal Greenstone Belt cluster and the Bullabulling gold/lithium nexus - are both visible as tight groupings of red white-bordered hexes at this resolution. Cross-reference with the written briefing sections 1A and 1B for the geological interpretation of each.
LAYER 3 - RETREAT / SURRENDER ZONES (Purple/Magenta Hexes)
What you are seeing: Areas where tenements have been surrendered or relinquished in the last 31 days. The purple-to-magenta colour scale represents risk intensity - soft violet indicates minor relinquishment activity, hot pink indicates a significant cluster of surrenders involving multiple companies.
Dashed hex borders on this layer signal that the surrenders are geographically concentrated - multiple companies retreating from the same specific corridor, not random portfolio pruning.
How to use it - three readings:
Reading 1 - The Distressed Seller. A surrender cluster in an otherwise quiet area may indicate ground that has been drilled quietly with disappointing results. Someone made a bet, lost, and left. Useful for avoiding areas where sophisticated parties have already done the technical work and walked away.
Reading 2 - The Acquisition Opportunity. A surrender cluster immediately adjacent to a high-activity hex is a different signal entirely. Ground is being vacated in a district where others are racing to peg. This could be a distressed junior creating a consolidation opportunity - ground that a better-capitalised party could pick up and add to a position in a validated district.
Reading 3 - The Intelligence Gap. When a company that has been visible in the activity layer suddenly appears in the surrender layer, that is worth investigating. Did they drill, get results, and strategically relinquish the less prospective portions while retaining the core? Or are they in financial difficulty? Context from the written briefing and ASX announcements will tell you which.
This week, the purple dots scattered through the southern WA Goldfields - particularly visible against the backdrop of the red dogfight hexes - represent the most actionable surrender signals. Cross-reference which companies are surrendering against the holder breakdowns visible in the District Dogfights layer for the same area.
LAYER 4 - THE WHALES (Cyan Outlines)
What you are seeing: Individual tenement polygons at their true geographic scale for any grant exceeding 500 km² awarded in the last 31 days. These are rendered in their actual shape - not aggregated into hexes - so you can see exactly what ground has been locked up and where.
How to use it: The scale of these polygons is deliberately confronting. A single cyan outline covering what appears to be a Belgian-sized area of the Pilbara or the Great Victoria Desert represents a single company making a single strategic bet on a district. When you see a cluster of cyan polygons overlapping with red activity hexes, you are looking at a province-scale consolidation thesis playing out in real time.
Hover over any whale polygon to see the holder, tenement ID, exact area in km², and state.
This week's primary whale positions - Archer X Pty Ltd at 5,605 km² and CGM (South Yilgarn) at 3,076 km² - are the largest cyan outlines visible in WA. These entities have locked up ground at a scale that requires significant capital to explore. They are the primary targets identified in the Corporate Finance section of this briefing (Section 2A).
LAYER 5 - STRATEGIC PIVOTS (Red Markers)
What you are seeing: Manually verified intelligence markers pinned to the precise geographic centroid of each named entity's tenement package. Unlike the hex layers which are generated automatically from raw data, these markers represent the specific companies, projects, and events called out in this week's written briefing. Coordinates are derived directly from the tenement database - not approximated.
How to use it: Each red dot is a georeferenced anchor point for a named insight in the briefing text. When you read about Yandal Resources' 30,000m drill program in Section 1A, the corresponding red marker shows you exactly where on the map that activity is anchored - and crucially, whether it sits inside a contested red hex (confirming the dogfight thesis) or in quieter ground (warranting further investigation).
Hover for a summary. Click for the full intelligence note including project name, ASX code where applicable, tenement count, total area, and the strategic context connecting that entity to this week's key themes.
The spatial validation test: For every strategic pivot, ask yourself: does the marker's location make sense against the surrounding hex layers? A pivot labelled as a dogfight epicentre should be sitting inside or immediately adjacent to red contested hexes. A pivot flagged as a near-ology opportunity should be visible on the fringe of high-activity hexes with green moderate-activity cells surrounding it. If the spatial picture does not match the written narrative, that is worth investigating before acting on the intelligence.
READING THE MAP AS A COMPLETE SYSTEM
The five layers are designed to be read in combination, not isolation. The highest-value spatial pattern to look for each week is:
Red contested hex (Layer 2) + Cyan whale polygon (Layer 4) + Red pivot marker (Layer 5) in close proximity - this combination indicates a district where province-scale capital has been committed, a pegging war is active at the district level, and a named entity from the intelligence briefing is the anchor. This is the spatial signature of a district transition - moving from speculative to validated. In this week's map, that combination is most visible in the southern WA Goldfields.
Purple surrender hex (Layer 3) immediately adjacent to red activity hex (Layer 2) - ground being vacated in an active district. Either an acquisition opportunity or a technical red flag depending on who is leaving and why.
Amber hex with no pivot marker and no whale - a district moving from quiet to competitive without yet attracting named attention. These are your early-mover signals for the following week's briefing.
Map generated automatically from live tenement registry data. Pivot markers verified against database centroids. All areas and counts reflect the 31-day trailing window with temporal decay weighting applied - recent activity is weighted more heavily than older activity within the window.