Finding Mining Projects Before They’re Listed: An AI Data-Driven Approach
Discover how AI identifies mining projects before they hit the market. Learn how data-driven models reveal divestment targets, synergy opportunities, and M&A insights—giving explorers and investors a first-mover advantage

Introduction: Lessons from the Property Market
When speaking with mining juniors recently about their search for gold projects, I was reminded of a conversation with a close friend looking to buy a house in Sydney. The properties they found online looked promising—yet every time they attended an open home, wealthy investors had already swooped in, outbidding them with ease. Great for the seller, not so great for the average buyer. Eventually, they managed to secure a pristine property in a prime suburb, but only because it was a private sale—not listed publicly, and therefore invisible to the "vulture" investors who would have quickly driven it out of reach.
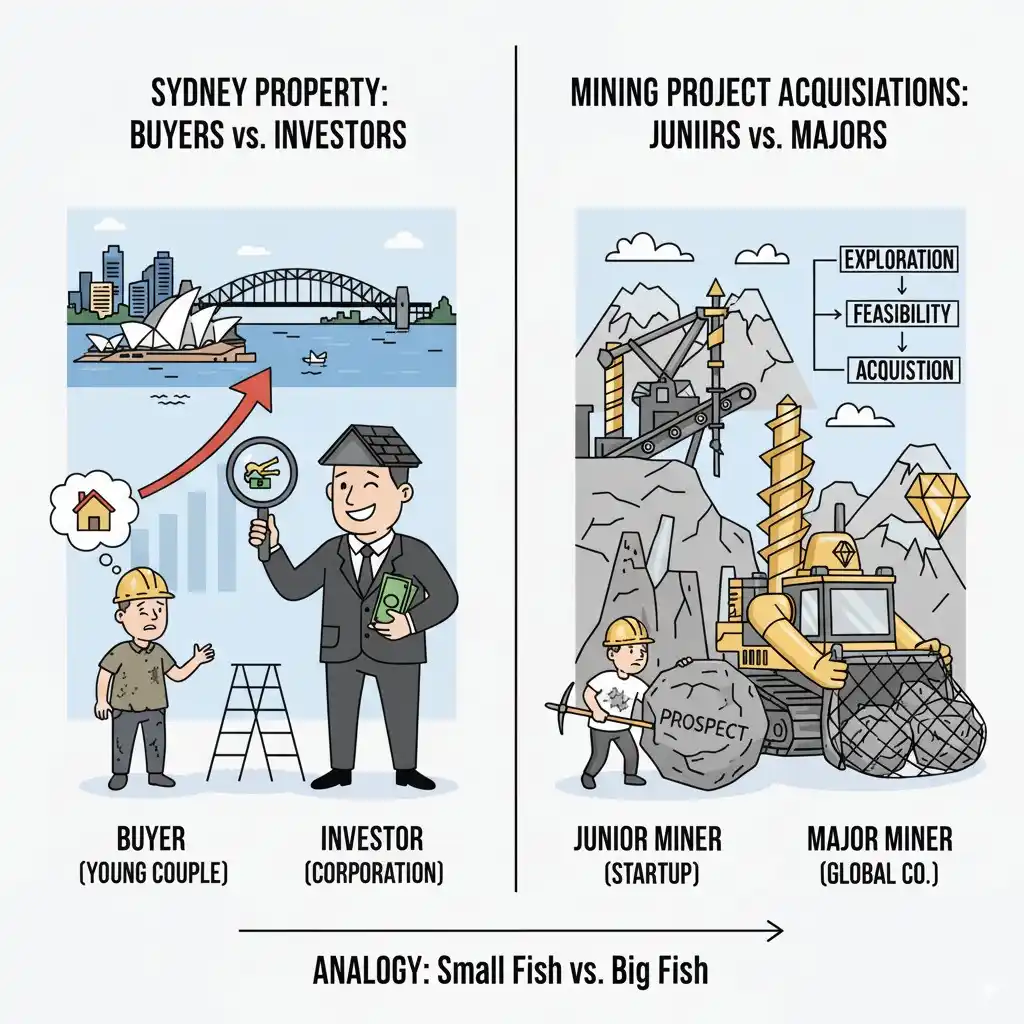
The same dynamic often plays out in mining. In a heated gold market, quality exploration projects in attractive districts are quickly snapped up by cashed-up mid-tiers and majors. Juniors are often left to chase what remains. But what if explorers could identify prime projects before they even come onto the market—before the owner company has decided to divest?
Why Juniors Struggle to Compete for Gold Projects
Pinpointing projects with high potential is more complex than it might appear. It requires a synthesis of:
- Market dynamics – cycles of capital flow into gold exploration.
- Company financial health – cash reserves, burn rates, and ability to raise capital.
- Project characteristics – location, stage of exploration, and scale potential.
- Geological fundamentals – whether the rocks themselves are prospective.
Historically, much of this process has been driven by gut feel, word-of-mouth networks, and relationships at conferences rather than systematic data analysis. But is there a way to shift toward a more data-driven exploration strategy? Can we leverage financial and geological signals to predict which projects are most likely to be divested—before the rest of the market notices?
Mining Project Divestment Patterns: The Catan Analogy
Discussions with project generator geologists reveal a recurring theme: companies sell projects when they need capital. The logic is simple. A company will prioritize advancing a small number of flagship assets. To free up cash, it will “sacrifice” projects that don’t align with its core focus—assets that might hold significant value for another operator.
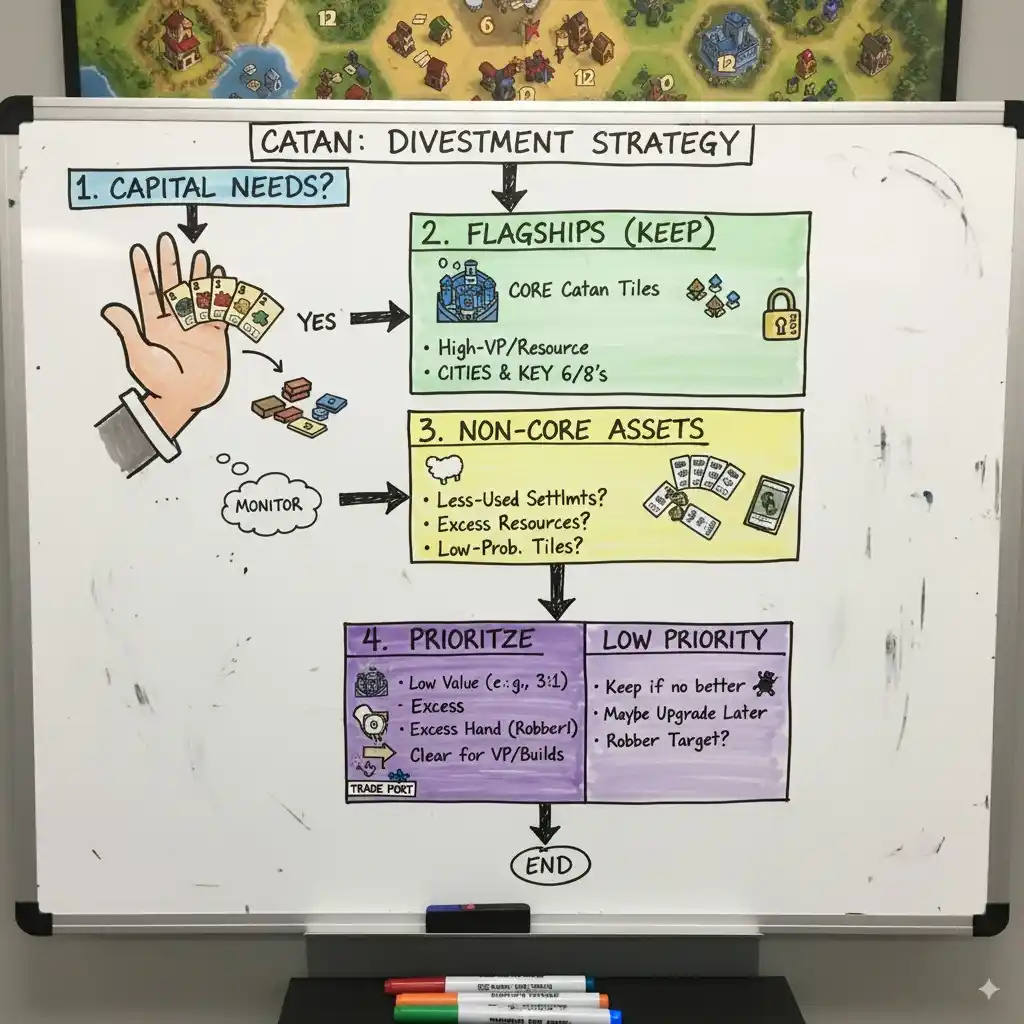
This is a familiar economic trade-off, not unlike the mechanics in the board game Catan, where players must exchange resources they have in surplus to obtain what they urgently need. For the seller, the project may be considered non-core, but for the right buyer, it could represent a strategic cornerstone.
Proactive vs. Reactive Exploration Deals
If we can systematically identify companies trending toward financial pressure and assess which of their projects are less central to their portfolio, we can approach them before they even decide to sell. This proactive strategy aligns with findings from sales research across industries: the best deals are struck when opportunities are identified early, ahead of competitive bidding.
Practically, this boils down to two key tasks:
- Identify financially stressed companies – a relatively straightforward exercise using publicly available data on listed explorers.
- Identify non-core projects – far less straightforward, requiring deeper analysis of project attributes, corporate disclosures, and geological context.
In this post, we’ll focus on the second challenge: how we can use AI and algorithmic approaches to identify non-core mining projects that could represent hidden opportunities for explorers.
What Constitutes a Non-Core Project in Mining?
This is the central challenge in evaluating exploration portfolios. Defining “non-core” isn’t straightforward, but through a combination of AI modeling, data research, and logical reasoning, we’ve developed a framework that can systematically identify such projects.
There is no single rule that applies to all companies. However, when several key factors are combined, a powerful definition emerges. Below, we outline the most important signals our framework uses to flag non-core projects likely to be candidates for divestment.
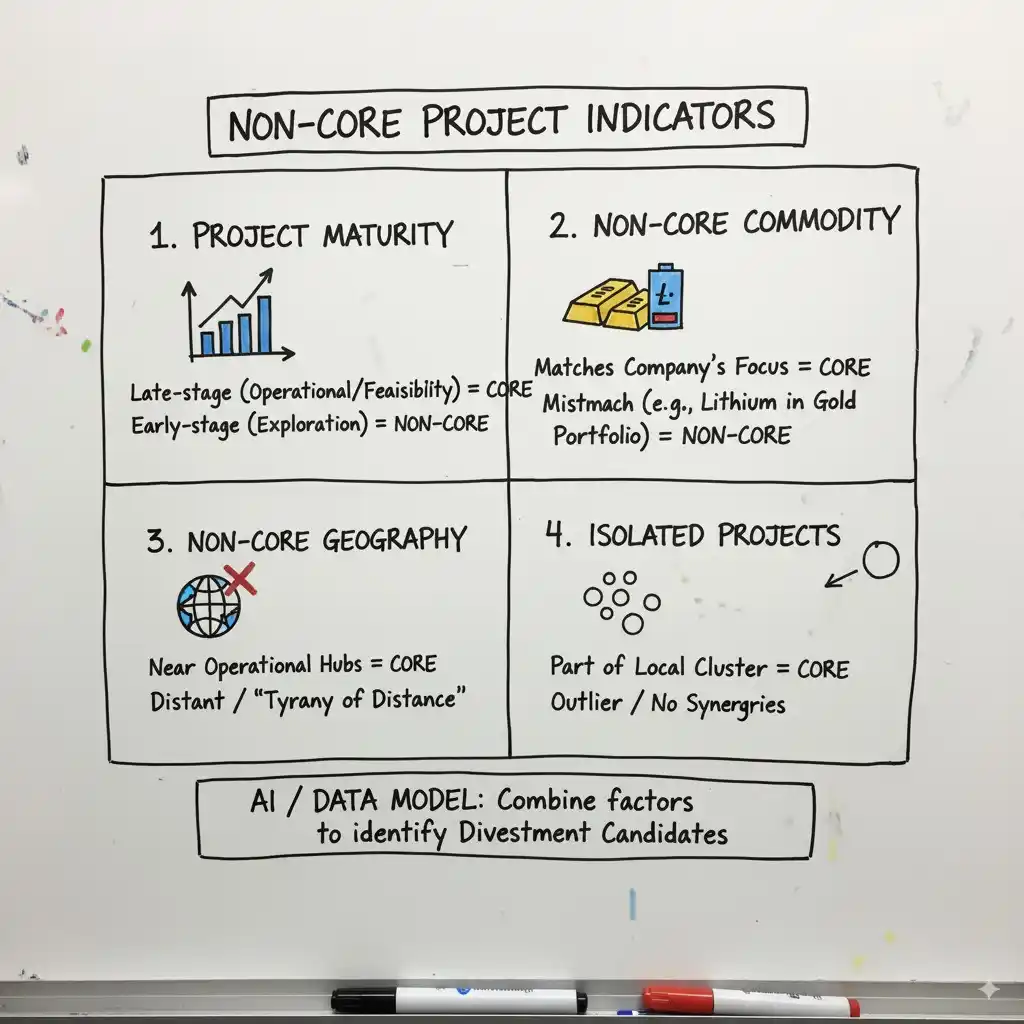
1. Late-Stage Projects Signal Corporate Priorities
A company’s true strategy is not reflected in its press releases—it is revealed through its largest capital commitments. Mining companies typically hold a portfolio ranging from grassroots exploration through to feasibility-stage assets and operating mines.
- Mature projects—those at feasibility stage or already producing—represent a heavy investment of money, time, and management focus.
- These projects are almost always considered “core,” as they define the company’s future growth and reputation.
We incorporated this into our framework through maturity weighting, which assigns higher importance to later-stage projects. This ensures that the analysis aligns with real-world corporate behavior, where advanced projects dominate decision-making.
2. Non-Core Commodities Create Strategic Disconnects
Leading mining companies are usually specialists, building deep institutional expertise around specific commodities. A portfolio dominated by gold, for example, reflects a different set of skills, technologies, and logistics than one focused on lithium or copper.
When a company holds an isolated project outside its main commodity focus, it often signals a misalignment. For instance:
- A single lithium project in a portfolio otherwise composed of gold assets may not fit the company’s technical expertise or strategic direction.
Our model first learns a company’s commodity playbook from its mature assets. It then scans the entire portfolio for mismatches, flagging those projects as potential candidates for divestment.
3. Geographic Alignment Matters
Mining success is often tied to geographic specialization. Companies that build hubs in specific regions benefit from optimized supply chains, strong local relationships, and deep regional knowledge.
When a project is located far from this operational heartland, it creates inefficiencies:
- Higher logistics costs.
- Increased management burden.
- Regulatory and cultural unfamiliarity.
We designed our model to detect these “geographic centers of gravity.” Projects located outside the defined core geography are flagged as logistical outliers, and therefore more likely to be non-core.
4. Isolated Projects Within Core Regions
Geography alone isn’t enough. A project can be in a “core country” but still be non-core if it is isolated from the company’s other projects.
Initially, we tried calculating the average distance between projects, but this approach was skewed by distant outliers. Instead, we adopted a more robust solution: an AI-driven dynamic clustering model.
This method works by:
- Focusing on local clusters – Projects close to one another receive low isolation scores.
- Handling outliers correctly – A single remote project is flagged as isolated without distorting the analysis of clustered assets.
This clustering approach provides a nuanced way to measure project isolation and identify candidates for divestment.
A Comprehensive Framework for Identifying Non-Core Assets
By combining all four factors—maturity weighting, commodity alignment, geographic focus, and isolation scoring—we created a robust, data-driven framework. This allows us to move beyond gut feel and systematically identify projects most likely to be considered non-core by their owners, and therefore potential acquisition opportunities for others.
From Identification to Prediction: The Leap to Predictive Targeting
The first three layers of our framework—maturity, commodity alignment, and geography—gave us a powerful lens for viewing portfolios from the seller’s perspective. They allowed us to identify assets that were poor strategic fits.
But this was only half the equation. A project is only divested if there is also a willing buyer. To truly anticipate market activity, we needed to answer a far more valuable question:
Of all the potential non-core assets, which ones represent the perfect fit for another operator?
This required a paradigm shift. Instead of just spotting misaligned projects, we had to detect the hidden synergies that make deals inevitable.
Layer 4: The Synergy Signal – Identifying the Perfect “Bolt-On”
Our most innovative breakthrough came with the development of the Synergy Signal. We realized that a project viewed as a liability by one company can simultaneously be a strategic “bolt-on” for another.
The value of a mining asset is not absolute—it is contextual, shaped by the infrastructure, commodity focus, and expertise that surround it.
Through geospatial analysis, our model expanded beyond individual company portfolios to the entire competitive landscape. What once looked like an isolated project could now be understood in its broader context:
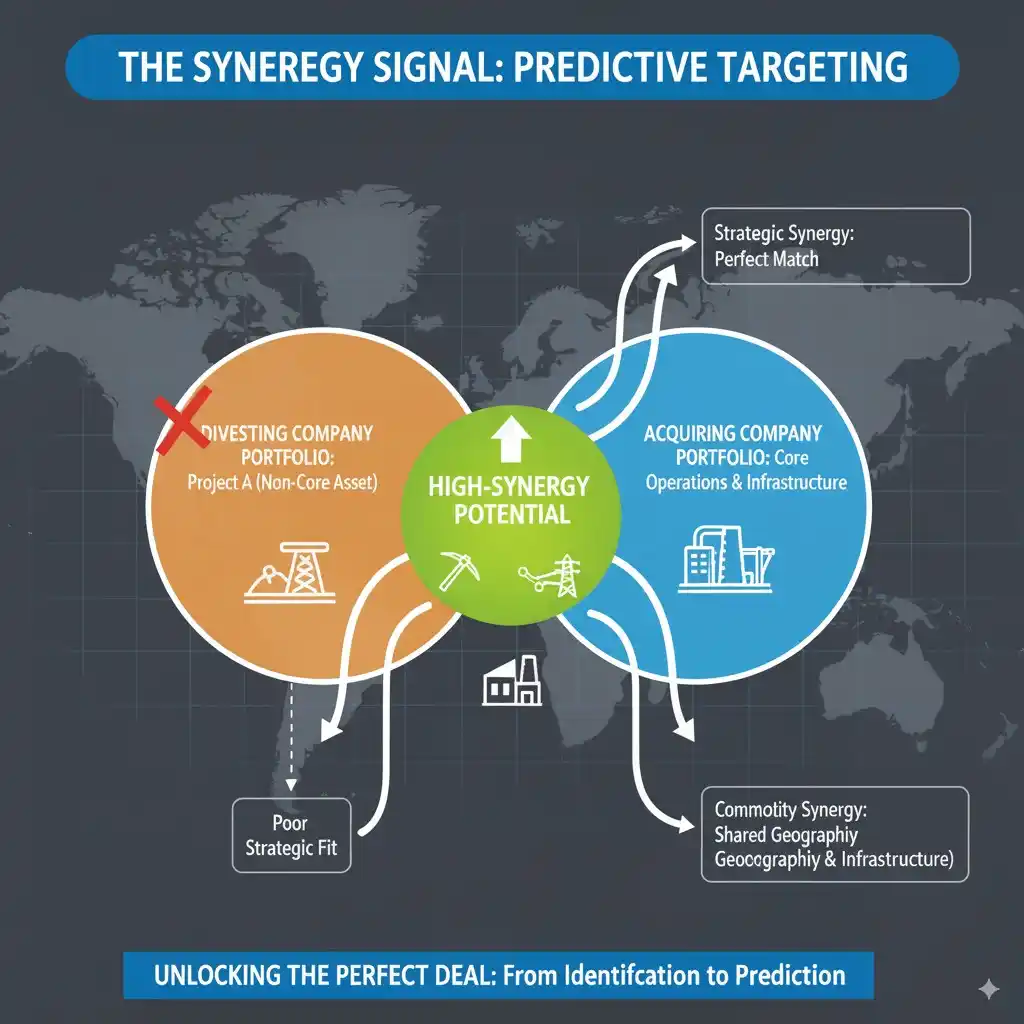
- High Synergy (The Perfect Match):
When a nearby competitor produces the same commodity, the fit is immediate. The buyer can plug the new asset into existing mills, processing plants, geological teams, and infrastructure. Our model flags these as the highest-potential opportunities. - Operational Synergy (The Infrastructure Advantage):
Even when commodities differ, proximity still matters. A neighboring operator may have already solved key challenges—building roads, securing power, or establishing a skilled workforce. This reduces development risk and makes the project significantly more attractive.
By integrating this buyer’s view, our framework evolved from simply identifying potential divestments to actively predicting where future M&A opportunities will emerge.
The Result: A Predictive Map of Mining Deals
By weaving together all four layers—maturity, commodity, geography, and synergy—we’ve created more than a dataset. We’ve built an AI-powered scoring engine that ranks projects by their likelihood of entering the market.
The outcome is a dynamic, predictive map of opportunities. Instead of seeing the mining industry as a static picture of assets, we now view it as a living system, where the interplay of financial stress, portfolio fit, and regional synergies point to the deals of tomorrow.
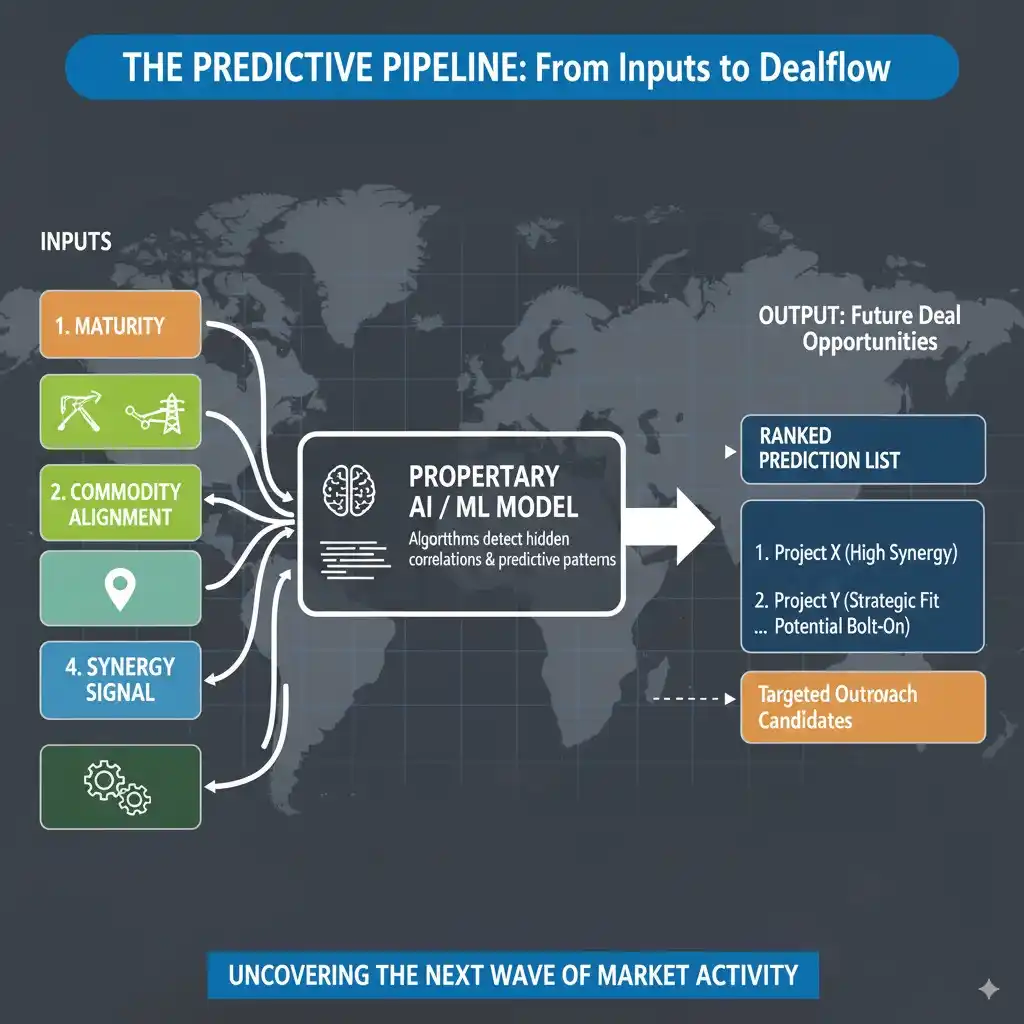
This shift—from descriptive analysis to predictive targeting—represents a fundamental rethinking of how explorers, investors, and strategists can approach project generation in the mining industry.
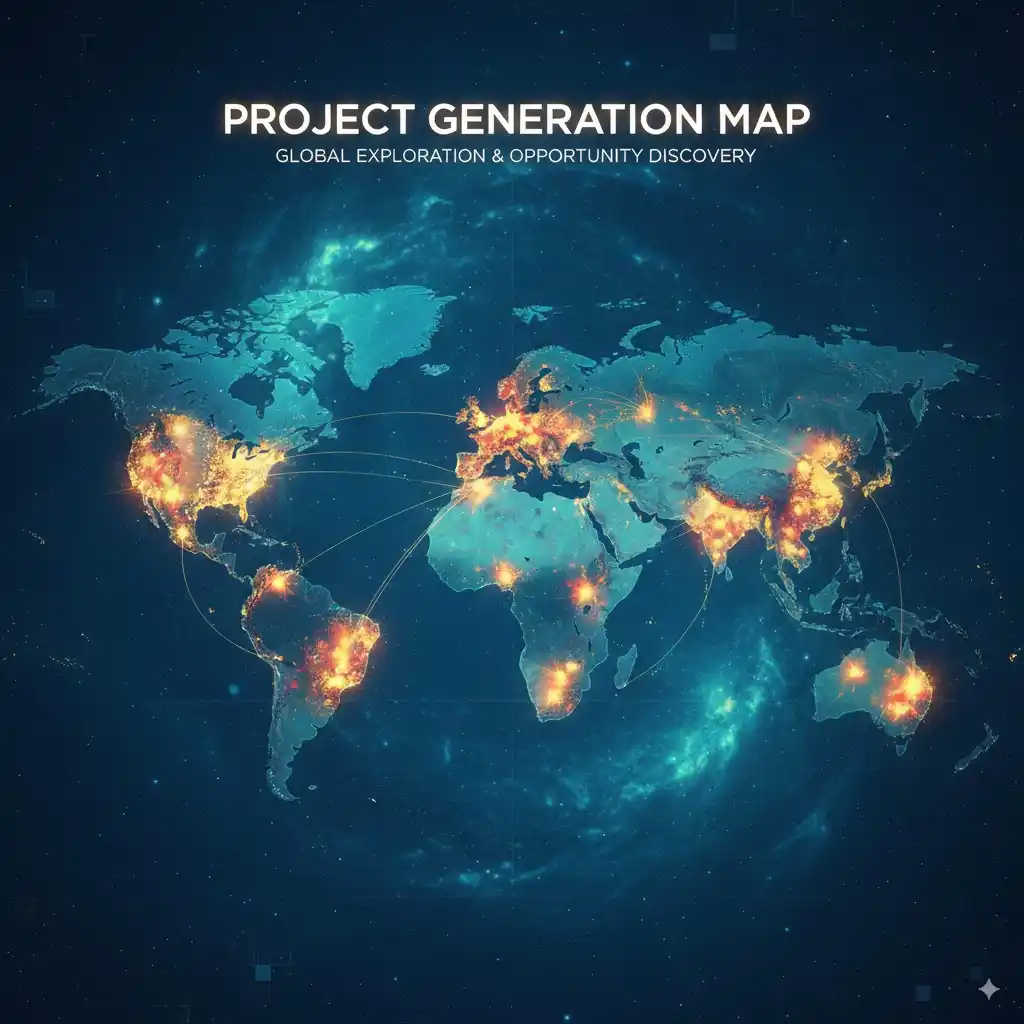
Visualizing Opportunity: A Guided Tour of the Project Generation Map
Sophisticated analysis is valuable, but the real test is usability: how does it help a business development team find opportunities? The answer is our interactive geospatial application, which transforms complex datasets into an intuitive Project Generation Map—a dynamic view of strategic potential across the mining industry.
Instead of a static map of mines and deposits, imagine a living landscape of opportunities. Assets are color-coded, filterable, and instantly responsive, allowing you to ask precise questions and get real-time answers.
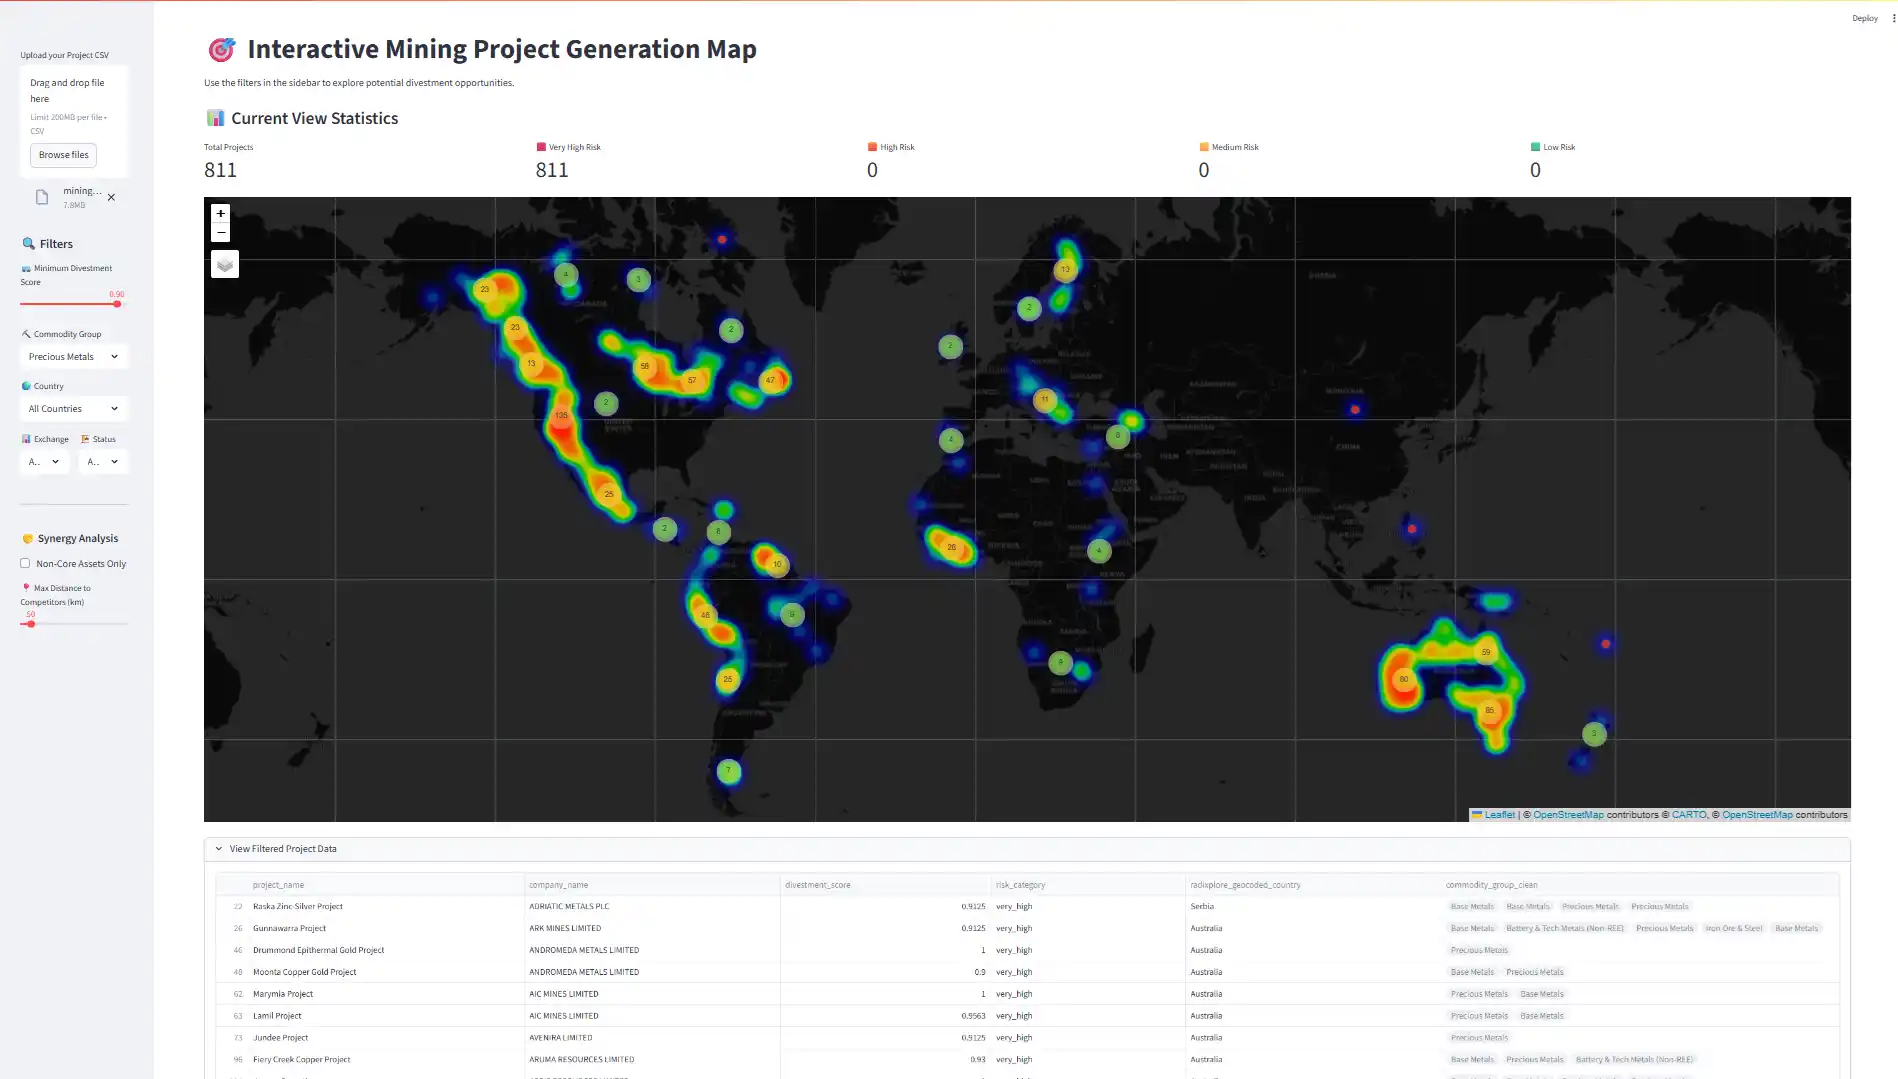
Your Control Panel: The Levers of Discovery
At the heart of the application is a control panel that lets you cut through thousands of projects to uncover the ones that truly matter.
- The Divestment Score Slider – Your “Opportunity Dial”
This is the master filter. Slide it right to eliminate low-potential projects and surface only those with the highest likelihood of divestment. The map declutters in real-time, leaving behind a focused set of high-value opportunities—projects that are misaligned, isolated, or strategically ripe for acquisition. - The Commodity Filter – Align with Your Expertise
Whether you’re targeting lithium, gold, copper, or rare earths, the commodity dropdown lets you zero in on your specialty. Select “Precious Metals” and the global map transforms into a targeted hunt for gold and silver projects, ensuring your efforts are aligned with your team’s strengths. - The Geographic Filter – Focus on Your Turf
Narrow results to a preferred jurisdiction—whether that’s Canada, South America, or Western Australia. By filtering for regions where you already have infrastructure, relationships, or permitting expertise, you eliminate noise and focus on realistic opportunities.
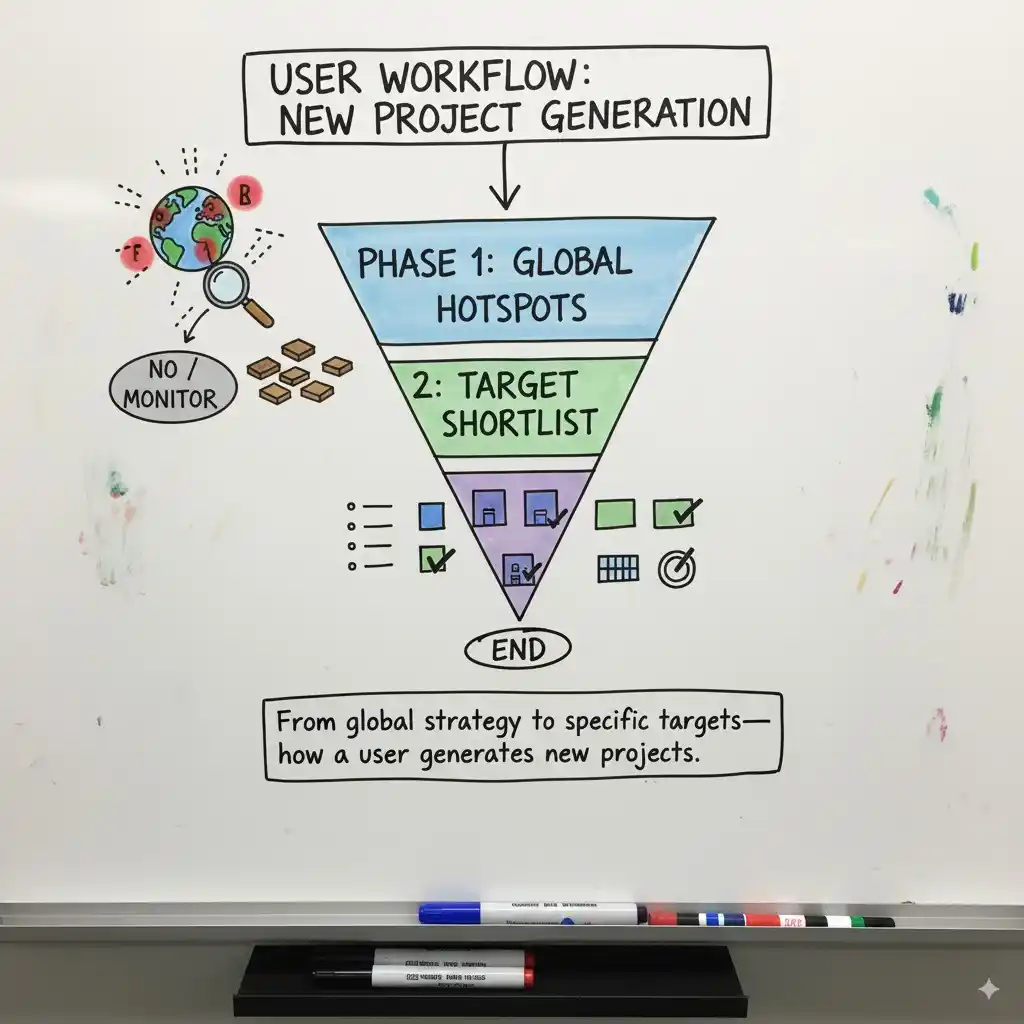
Interacting with the Map: From Global Strategy to Specific Targets
The map itself is designed as an interactive workspace—a tool that moves seamlessly between high-level insights and actionable detail.
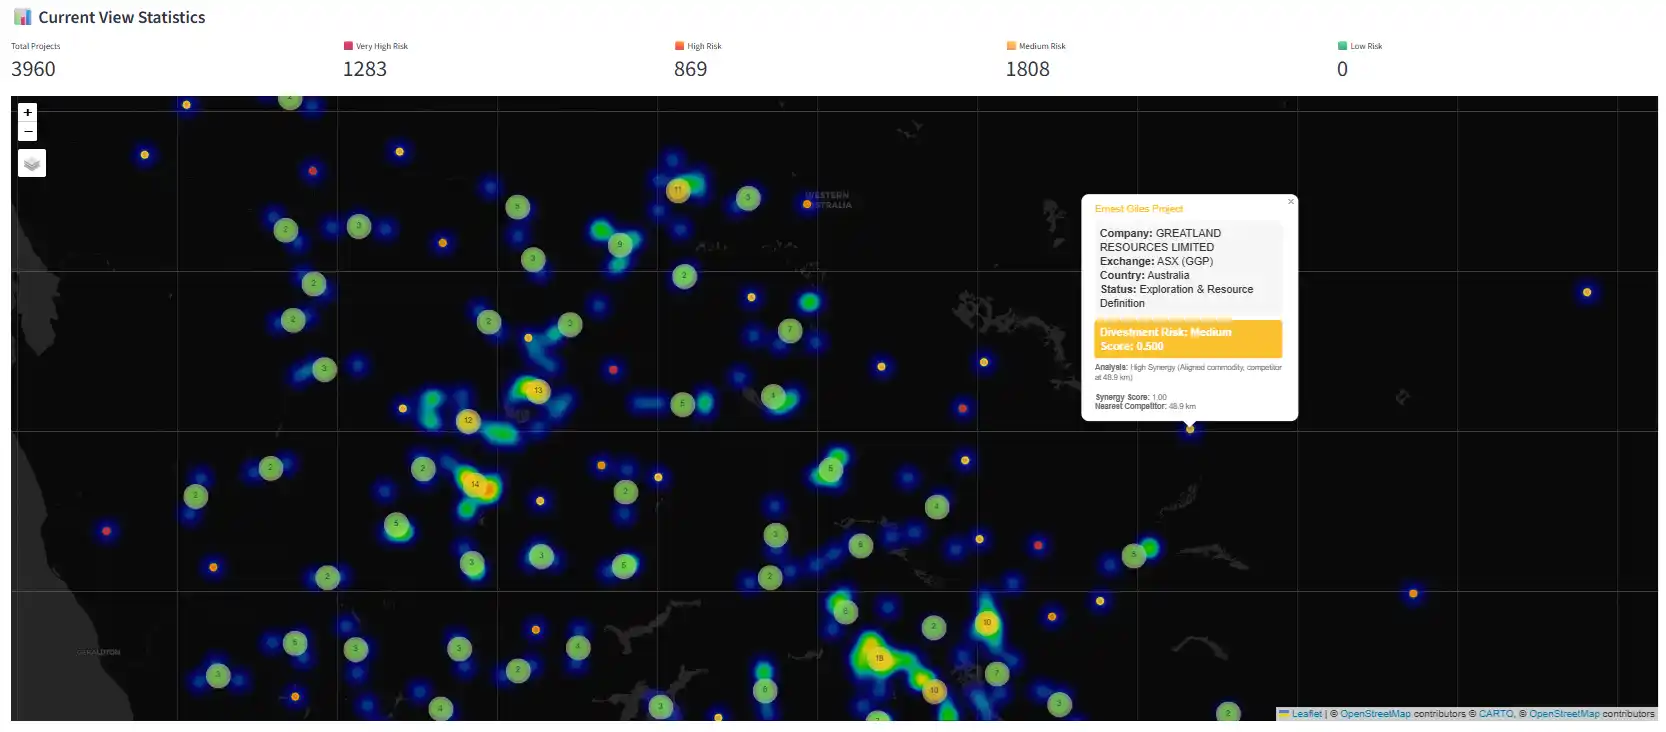
- Heatmap View – Revealing Strategic Hotspots
With one click, the project pins transform into a glowing heatmap. Areas rich in high-scoring divestment candidates shine red, instantly revealing M&A hotspots across key geological belts. This top-down perspective highlights not just projects, but the strategic pulse of entire mining regions. - Intelligent Clustering – From Macro to Micro
Thousands of projects are automatically grouped into clusters when zoomed out, creating a clean overview. As you zoom into a hotspot, clusters split apart to reveal individual assets, allowing smooth navigation from regional strategy to specific opportunities. - The Pop-Up Dossier – Context in a Single Click
Clicking a project pin opens a concise project dossier, complete with ownership, divestment score, and rationale.Example:In seconds, the system identifies a strategic orphan—a gold project held by a lithium company—insight that would normally take analysts weeks to uncover.- Project: Cimarron Gold Project
- Owner: Surface Metals Inc.
- Divestment Score: 0.875
- Summary: Commodity mismatch (Precious Metals project in a Lithium-focused company); High isolation.
From Visualization to Prediction
By combining filters, scoring, and geospatial intelligence, the Project Generation Map becomes more than a visualization tool. It is a predictive engine for business development. Users can move from broad global strategy to a specific, prioritized shortlist of acquisition targets in minutes.
It’s a new lens for viewing the mining industry—built not just to show what exists today, but to highlight where tomorrow’s opportunities will emerge.
Who Would Use It — and How?
In mining, project generation is the lifeblood of growth. It’s the process of identifying and acquiring new assets to explore or develop. Our geospatial application transforms this process into a strategic advantage—turning static maps into dynamic engines of opportunity.
Instead of mapping rocks, drill holes, and deposits, we’re mapping corporate strategy and predicting divestments before they hit the market. The result: a new way of uncovering undervalued, misaligned, or overlooked projects.
Traditional exploration tools show where resources are.
Our application shows where opportunities will be—using corporate portfolios, maturity analysis, and predictive signals.
It’s the difference between describing the past and forecasting the future.
Here’s how different users would experience this transformation.
User Persona: Head of Business Development at Golden Apex Mining
Imagine you are the Head of Business Development at Golden Apex Mining, a mid-tier company focused on gold in North America. Your mandate: secure the next high-potential gold project.
Here’s how you’d use the Project Generation Map in three distinct phases.
Phase 1: Strategic Area Selection (The 30,000-foot view)
- Filter for Fit
- Commodity: Precious Metals → The map narrows to gold, silver, and PGMs.
- Geography: Canada + United States → Zooms to your home turf.
- Divestment Score Filtering
- Slide to >0.7 → The clutter disappears, leaving concentrated clusters in Nevada, Quebec, and Ontario.
- These clusters = “opportunity hotspots.”
- Heatmap Analysis
- Toggle Heatmap → Nevada glows bright red, signaling the region with the highest density of near-term divestment candidates.
- Nevada becomes your primary Area of Interest.
Phase 2: Target Identification (The 5,000-foot view)
Zooming into Nevada, the heatmap resolves into individual project pins.
- Finding the “Orphans”
- You hover over a project: Cimarron Gold Project, owned by a lithium company. Divestment Score: 0.875.
- A strategic orphan: non-core for them, core for you. → Add to Target List.
- Finding “Bolt-On” Acquisitions
- You draw a 50 km circle around your existing mine.
- Two projects appear, one a small gold asset owned by a copper major.
- The dossier highlights: Operational synergy, competitor 2.1 km away.
- That competitor is you. Perfect bolt-on. → Add to Target List.
Phase 3: Greenfield Exploration (The New Frontiers)
Project generation isn’t just M&A—it’s also about staking open ground.
- Nearology Analysis
- In a historic gold belt, you spot a gap between two producing mines.
- Overlay geology → A favorable structure runs through the unclaimed ground.
- Prime greenfield staking opportunity.
- Identifying New Frontiers
- Reverse the filter: show companies with low divestment scores (tight portfolios).
- Notice several of them entering the same emerging district.
- This is the leading edge of a new exploration frontier. You now know where the smart money is going—before the market catches on.
Why This Is a Game-Changer
- Predictive, Not Reactive → Anticipate assets likely to hit the market 6–12 months ahead.
- Strategy-Based Filters → Search by portfolio misalignments, not just geology.
- Instant Shortlisting → Weeks of analyst work condensed into minutes.
- Dual-Use Tool → Equally powerful for brownfield M&A and greenfield exploration.
This isn’t just a map. It’s a strategic intelligence system that transforms how mining companies find, evaluate, and acquire their next projects.
Case Study: The Anatomy of a Perfect Divestment Target
Our predictive model isn’t just a theoretical framework—it’s a lens on reality. When applied to a global database of thousands of mining projects, it didn’t simply produce a list. It surfaced stories of strategy, synergy, and opportunity hiding in plain sight.
The first results were striking: a set of projects that scored a perfect 1.0 divestment score. Each of these assets represents a “perfect storm” candidate—misaligned with its current owner, isolated from portfolio peers, and sitting beside an obvious acquirer.
Let’s break down the anatomy of these top-tier targets.
Pattern 1: The “Continental Divide” — Extreme Geographic Mismatch
The most dominant signal: a project marooned on the wrong continent. For companies focused tightly on one region, managing a lone outlier is operationally and financially unsustainable.
- Southern Hemisphere Mining Limited
- Core Focus: Chile
- Outlier: New Cardawan Copper (Australia)
- Isolation: 13,781 km from portfolio peers
- The Story: A Chilean operator with an Australian side project—classic non-core distraction. Far better suited to a local buyer.
- Pasinex Resources Limited
- Core Focus: Turkey
- Outlier: Gunman Project (Nevada, USA)
- Isolation: 10,815 km
- The Story: A Turkish-focused company burdened by a U.S. project with completely different geology, regulations, and logistics.
Pattern 2: The “Strategic Orphan” — Commodity Mismatch
Just as costly as geography misfit is commodity misfit. A project that lies outside a company’s technical wheelhouse is more liability than asset.
- Refined Energy Corp.
- Core Focus: Uranium (Saskatchewan, Canada)
- Outlier: Horizon South, Lithium (Nevada, USA)
- The Story: Uranium geology and lithium geology require entirely different teams, processing methods, and markets. This lithium asset is a strategic orphan, flagged by the model as both a commodity and geographic mismatch.
Pattern 3: The “Perfect Neighbor” — High Synergy, High Probability
The final trigger separating “non-core” from “likely to divest” is the presence of a ready-made buyer next door. Every single one of the top 25 had a competitor operating less than 50 km away.
- Silver Dollar Resources Inc.
- The Setup: Silver project in Idaho, while core operations are in Mexico
- The Signal: Neighboring silver-lead-zinc project just 1 km away
- The Story: To Silver Dollar, this asset is a distraction. To the neighbor, it’s a high-synergy bolt-on with immediate infrastructure leverage.
The Ultimate Validation: When Predictions Match Reality
The most exciting outcome? Our model independently flagged projects that had already been divested in the real world—without knowing those deals had closed.
- Vindication #1: Iris Metals Limited
- Our Finding: Kookynie Gold (Australia) scored 1.0 — geography + commodity mismatch, with a neighbor just 0.2 km away.
- The Reality: Divested to Nex Metals Explorations in April 2024.
- Vindication #2: Celsius Resources Limited
- Our Finding: Opuwo Cobalt-Copper (Namibia) scored 1.0 — an outlier for a Philippines-focused company.
- The Reality: Marked as divested.
This is the ultimate proof: the model isn’t just theoretical. It mirrors the strategic reasoning of corporate development teams, anticipating deals months before they hit the market.
What Comes Next: Strategic Deep Dive
While the global list is a powerful proof of concept, the real value comes when you apply the model to specific jurisdictions. For example, zooming into Australia allows a deeper, buyer-focused view of the top candidates—prioritizing by synergy, infrastructure, and market timing.
In the next section, we’ll think like a Head of Business Development at an Australian-focused miner, and walk through the due diligence process on a shortlist of standout projects.
Case Study: Uncovering Opportunity in the Australian Outback
Top 25 Divestment Candidates in Australia
Our global analysis produced a compelling list of “perfect storm” divestment candidates. But the real power of this framework emerges when we zoom into a single world-class jurisdiction.
By filtering for Australian projects with a perfect 1.0 divestment score, we created a shortlist of 25 assets that aren’t just statistically interesting—they represent real, near-term acquisition opportunities for any company seeking to expand its Australian footprint.
A closer look reveals three recurring archetypes of opportunity.
The Three Archetypes of Opportunity
1. The “Foreign Distraction” (The Majority)
- Who they are: Projects in Australia owned by companies headquartered elsewhere—Canada, Malaysia, Zambia, Sierra Leone.
- Examples: Lancaster Resources, Monument Mining, Benz Mining, Sandstorm Gold.
- The Opportunity: For the parent, these are distractions—logistical hurdles, time zone headaches, and lack of local expertise. For an Australian operator, they’re low-hanging fruit, often with highly motivated sellers eager to recycle capital back to home markets.
2. The “East vs. West” (The Domestic Mismatch)
- Who they are: Australian companies whose assets are stranded far from their operational hub. A classic case: a WA-focused company holding one project in Queensland.
- Examples: AIC Mines, Aeris Resources, Zenith Minerals.
- The Opportunity: These deals unlock operational efficiency. The asset isn’t flawed—it’s just in the wrong portfolio. For a buyer with local infrastructure, it’s a bolt-on that reduces costs and increases scale.
3. The “Strategic Pivot” (The Commodity Mismatch)
- Who they are: Companies shifting their corporate identity—often toward “critical minerals”—while legacy gold or base metal projects linger on the books.
- Examples: Andromeda Metals, Australian Gold and Copper.
- The Opportunity: These sellers are motivated by narrative discipline. Divesting legacy projects strengthens their investor story, creating a win-win for buyers who specialize in those commodities.
Buyer’s Due Diligence: Two Standout Targets
The shortlist is powerful—but the real magic comes when we move from macro pattern recognition to micro-level validation. Here’s how a buyer would think about two standout opportunities.
Target 1: Andromeda Metals — Drummond Gold Project
Archetype: Strategic Pivot
- The Model’s Story: Gold in Queensland, owned by a company pivoting to industrial minerals in South Australia. Mismatch on both commodity and geography, with a neighbor literally next door (0.0 km).
- Due Diligence Checklist:
- Identify the neighbor: Who are they? Do they own a mill or are they pure exploration?
- Check historical drilling: Are results consistent “average gold” or do they show high-grade potential?
- Review expenditure: Has Andromeda invested meaningfully, or just kept the license alive?
- Understand the pivot: When did Andromeda reposition itself, and how strong is their motivation to divest?
Target 2: Aeris Resources — Jaguar Operations
Archetype: East vs. West
- The Model’s Story: Zinc/Copper/Gold in WA, placed on care & maintenance, while Aeris’s producing assets are in NSW and QLD. An outlier in every sense—with a competitor just 8.4 km away.
- Due Diligence Checklist:
- Why was it mothballed? Price-driven, or technical issues?
- Review the Restart Feasibility Study: What are the updated economics and capital requirements?
- Assess existing infrastructure: Is there a plant, tailings facility, or power supply ready to go?
- Competitor synergy: Can ore be toll-treated nearby, creating a hub-and-spoke advantage?
The Takeaway
The Australian analysis proves the model’s real value: it cuts through the noise of thousands of projects, revealing a handful of strategically misaligned assets that are primed for acquisition. From there, buyer due diligence can focus only where it matters most—projects with a realistic chance of turning into actionable deals.
Conclusion: From Insight to Action
Mining project generation is no longer just about spotting deposits on a map or tracking drill results. It’s about understanding corporate strategy, operational realities, and market dynamics—before a project even hits the market.
Through our predictive divestment model, we’ve shown how AI and geospatial analysis can transform the way buyers approach the market:
- Identify non-core assets based on maturity, commodity, geography, and isolation.
- Predict divestment potential by factoring in buyer synergy and strategic fit.
- Prioritize actionable opportunities for brownfield acquisition or greenfield exploration.
- Validate targets rapidly with historical project data, saving weeks of research and allowing teams to focus on high-probability deals.
The case studies in both the global and Australian contexts demonstrate that this approach is not just theoretical—it mirrors real-world divestments and highlights opportunities that would otherwise remain hidden.
RadiXplore: Your Rapid Due Diligence Engine
All of this intelligence—project scoring, geographic and commodity analysis, and predictive targeting—is fully integrated into the RadiXplore platform. Beyond identifying high-potential acquisitions, RadiXplore serves as a rapid due diligence tool:
- Track market activity in real time by analyzing company updates across the ASX and TSX.
- Uncover portfolio signals through project ownership, expenditure patterns, and corporate strategy.
- Identify high-value opportunities fast with synergy and bolt-on analysis completed in minutes, not weeks.
- Learn from the past with RadiXplore’s Historic Company Postmortems—see what companies tried, why they acted, and whether they succeeded.
With RadiXplore, mining companies can move from reactive project chasing to strategic, data-driven project generation, gaining a competitive edge in a crowded market.
Whether you’re a mid-tier miner seeking your next gold project or a major looking to expand efficiently, RadiXplore transforms complex data into actionable intelligence, helping you see not just where projects are—but where opportunities will be tomorrow.
Whether you’re a mid-tier miner seeking your next gold project or a major looking to expand efficiently
RadiXplore transforms complex data into actionable intelligence, helping you see not just where projects are—but where opportunities will be tomorrow.
Contact Us