From Outliers to Opportunity: Inferring New Mineral Targets with AI, RGP GCAS Data and Saudi MODS
Discover how AI-powered geochemical analysis reveals high-potential mineral targets across Saudi Arabia. Learn how blind anomalies aligned with known deposit signatures uncover new exploration opportunities in the Arabian Shield.

Saudi Arabia is undergoing a geoscientific transformation through its Regional Geological Survey Program (RGP)—a cornerstone initiative led by the Saudi Geological Survey (SGS) to support the Kingdom’s Vision 2030. At the heart of this effort is the Geochemical Survey for the Arabian Shield (GCAS/GSAS)—a high-resolution, data-driven program to unlock the region’s vast mineral potential.
What Is the GCAS Geochemical Survey?
The GCAS (Geochemical Atlas of Saudi Arabia Survey) is one of the most ambitious national geochemical mapping efforts globally. Covering nearly 600,000 km² of the mineral-rich Arabian Shield in western Saudi Arabia, the GCAS survey aims to produce geochemical datasets at an unprecedented scale and resolution.
Key Objectives
- Deliver comprehensive geochemical maps and atlases to support mineral exploration.
- Attract foreign and local investment into Saudi Arabia’s mining sector.
- Contribute to environmental assessments and land use planning.
- Support Saudi Arabia’s goal of establishing mining as the third pillar of its economy.
Methodology
- Sampling Density: One stream sediment or heavy mineral concentrate sample per 6.25 km²—a much higher density than traditional surveys.
- Element Coverage: Analysis for 60–77 chemical elements, including ultra-trace detection for gold and PGE (Platinum Group Elements).
- Digital-First Approach: All fieldwork is captured via handheld GPS-enabled devices with integrated cameras and data logging.
- Quality Control: International best practices including duplicates, blanks, and standard reference materials are used to ensure reliability.
With tens of thousands of XRF-analyzed grab samples, the GCAS dataset offers immense value for intelligent mineral exploration. Here we attempt to extract actionable insights from this dataset using AI, geostatistics, and modern geochemical workflows for the purpose of mineral target generation.
How can this dataset be used for mineral target generation?
1. Foundational Interpretation & Mapping
Visualize element distribution (e.g., Au, Cu, Pb, Zn, As, Fe) across the region to pinpoint anomalies and generate initial targets.
Ratio Maps
Element ratios (e.g., Au/As, Cu/Zn, K/Al) are more robust than single-element concentrations for detecting mineralization or alteration halos.
Visual Tools
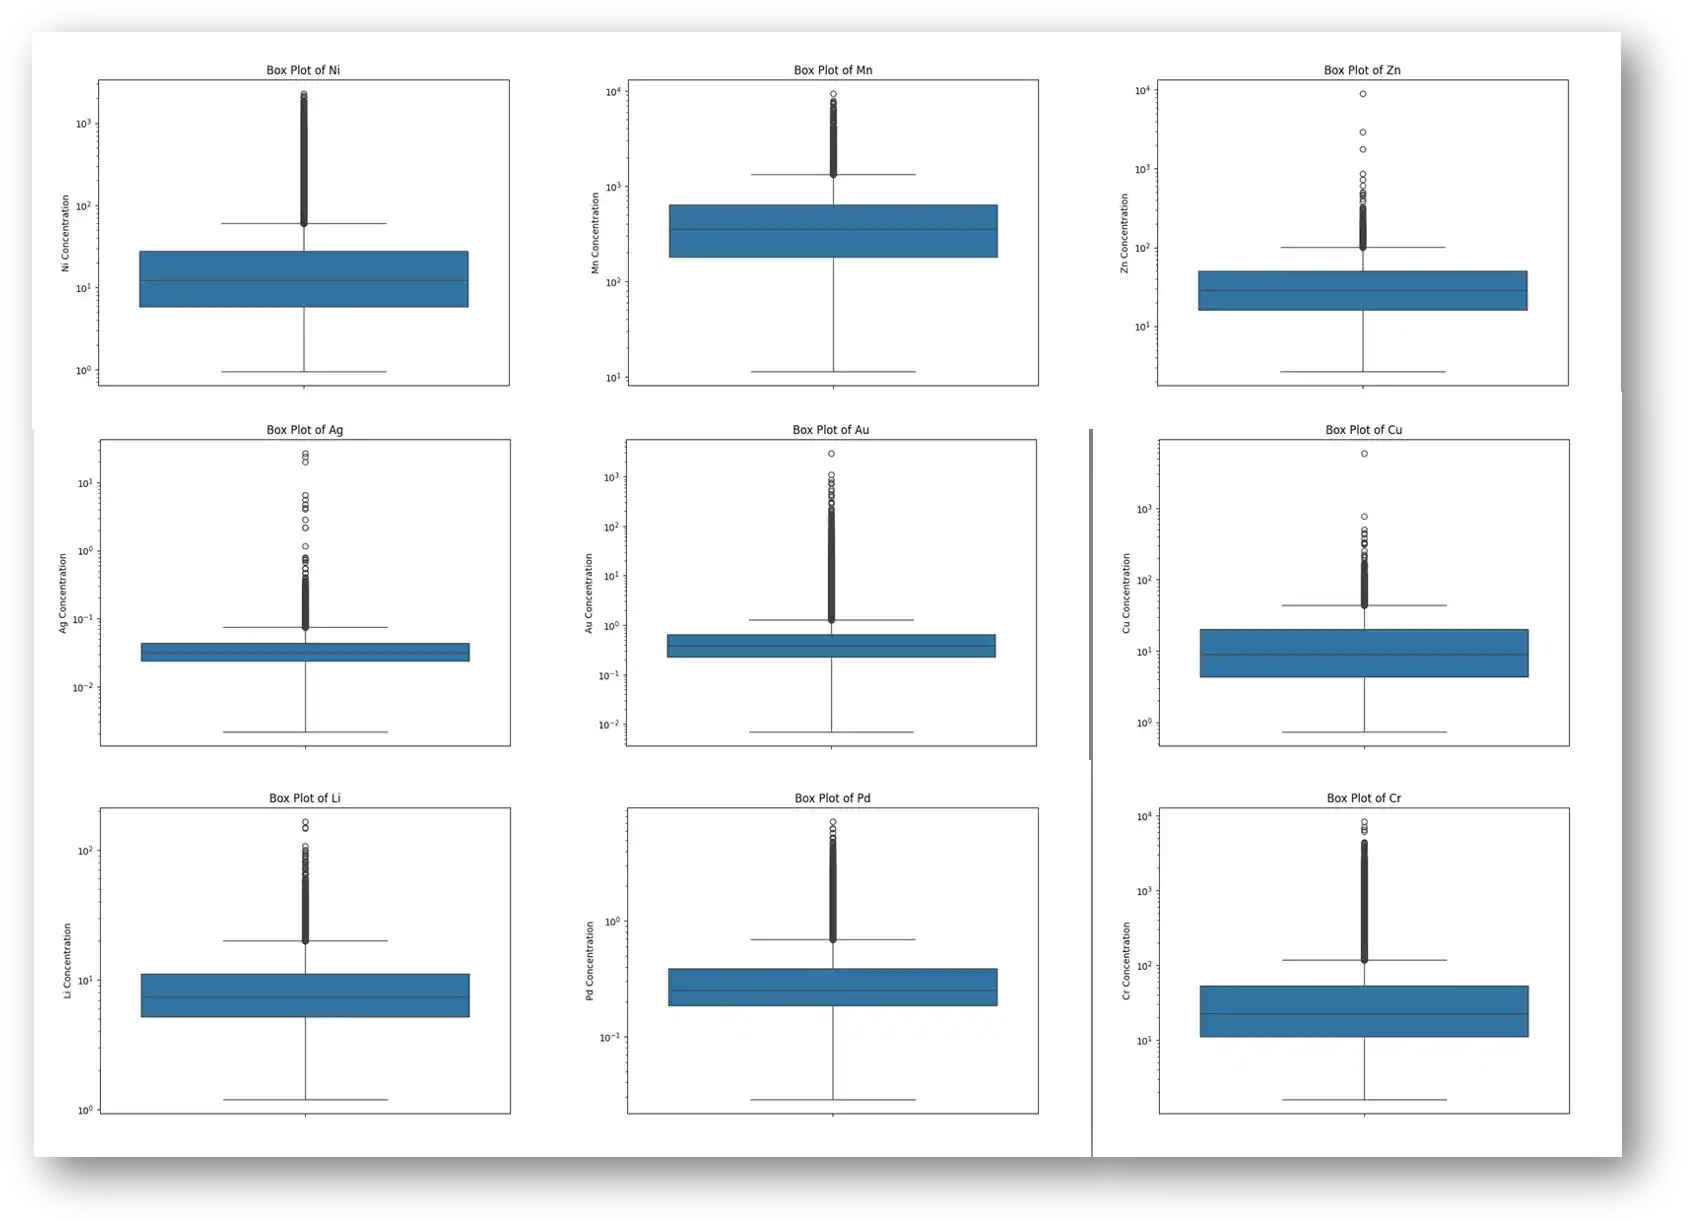
Use histograms, boxplots, and scatter plots to analyze element distribution and correlations—e.g., Au vs As for identifying gold pathfinder signatures.
2. Geochemical Fingerprinting with AI
- Spider diagrams to compare sample types.
- Alteration indices (e.g., Ishikawa Index) to map hydrothermal zones.
AI-Enhanced Fingerprinting
- Unsupervised Learning (PCA, clustering, t-SNE): Automatically group samples into clusters representing rock types, alteration styles, or potential mineralization zones.
- Supervised Learning (Random Forest, SVM): Train a classifier using known mineralized vs. barren samples to tag and score new data points.
3. AI-Powered Prospectivity Mapping
Integrate with:
- Geology: Lithology, structures, faults
- Geophysics: Magnetics, gravity, radiometrics, EM
- Remote Sensing: Sentinel/Landsat imagery for alteration mapping
- Topography: DEM-derived slope and drainage for dispersion modeling
Then apply AI models to:
- Build predictive models using supervised ML (e.g., neural networks)
- Generate prospectivity heatmaps identifying statistically significant mineral targets
4. Data QA/QC & Anomaly Detection
Use AI to flag anomalous values—either errors or true high-interest targets that deviate from the regional norm
- Spatial Clustering
Cluster-based approaches help delineate the footprint of geochemical halos more effectively than simple threshold-based anomaly detection.
Can Outlier Detection Reveal Hidden Mineral Targets?
Yes — outlier and anomaly detection methods can play a critical role in identifying previously unrecognized mineralization zones within large geochemical datasets like those produced by the RGP GCAS program. These techniques allow geoscientists to isolate both univariate anomalies (individual elements) and multivariate anomalies (complex geochemical signatures) that could represent subtle or overlooked exploration targets. These are the two different outlier detection techniques we will implement here - one statistical and the other AI-based.
IQR Outlier Detection: Univariate Anomalies
One of the simplest yet most effective statistical tools in geochemistry is the Interquartile Range (IQR) method. It highlights values that fall well outside the central 50% of the data distribution.
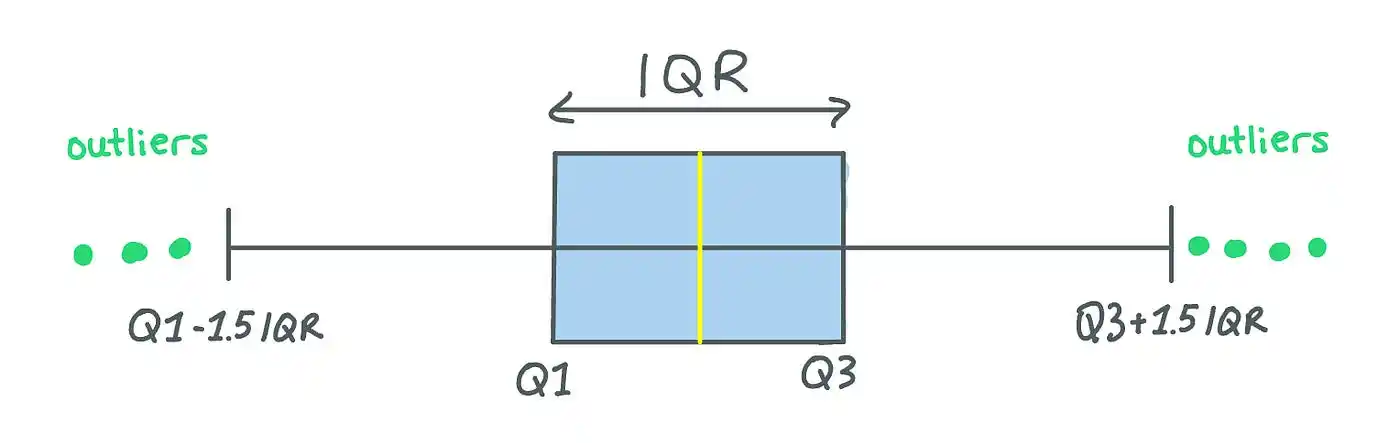
- How It Works: The IQR is calculated as the difference between the 75th and 25th percentile of a dataset. Any data point beyond 1.5 times the IQR above the 75th percentile or below the 25th percentile is flagged as an outlier.
- Why It Matters: In mineral exploration, these outliers often correspond to elemental enrichment—such as high arsenic, antimony, or gold values—that might mark hydrothermal alteration or mineralization zones.
- Use Case: If you're screening for elevated copper values, for example, IQR outliers could highlight stream sediment samples that sit well above the background trend, pointing to potential sources upstream.
This method is ideal for quickly flagging single-element anomalies, making it an essential first-pass filter when evaluating large datasets.
Isolation Forest: Multivariate Anomaly Detection
While the IQR is effective for one element at a time, real mineral systems are rarely so simple. That’s where Isolation Forests, a type of machine learning algorithm, offer a powerful advantage.
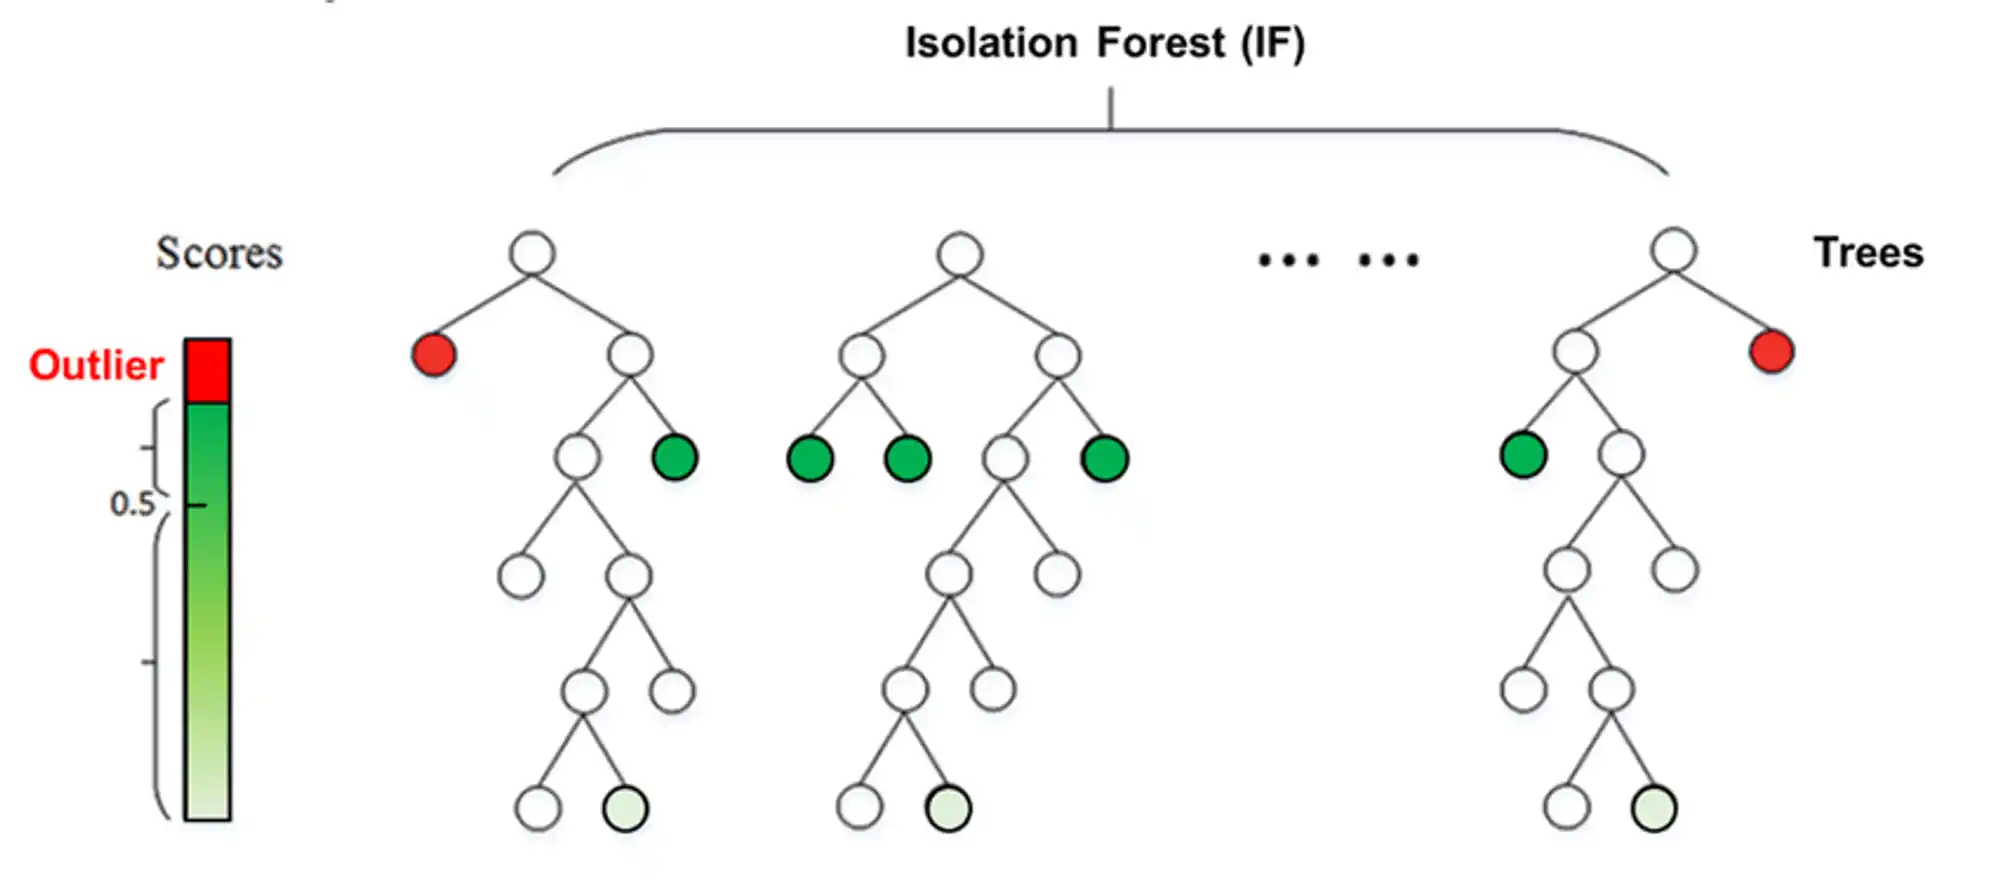
- How It Works: Isolation Forests analyze all elements simultaneously, identifying samples that are “isolated” from the rest based on their full geochemical profile.
- Significance: A sample may not stand out in any one element, but when we consider the combination of multiple trace elements, it may show a unique fingerprint—indicating complex mineralization styles like polymetallic veins or IOCG systems.
- Geological Value: This technique excels at finding subtle, multivariate geochemical anomalies that would be missed by traditional thresholding methods. These may represent deeper or blind targets not visible at surface.
By flagging samples that don't conform to the dominant geochemical trends, Isolation Forests can help us:
- Detect pathfinder associations and complex alteration halos.
- Prioritize areas for follow-up sampling or geophysical surveys.
- Reduce noise and bias in large, heterogeneous datasets.
Our Methodology: Using Outlier Detection to Uncover Hidden Mineral Deposits in the Arabian Shield
The Saudi RGP GCAS dataset offers an unprecedented opportunity for data-driven mineral exploration. Our approach centers on combining clean, high-resolution geochemical data with statistical and AI-powered anomaly detection methods to pinpoint previously unrecognized mineral targets across the Arabian Shield.
Step 1: Preparing and Cleaning the GCAS Geochemical Data
Key Data Preparation Tasks
- Handling Detection Limits (DLs):
- Geochemical datasets often include values reported as
<DL(below detection limit). - To keep the data usable for statistical and machine learning models, we replace
<DLvalues with DL/2—a widely accepted method that:- Acknowledges the element is present but at a low concentration.
- Prevents distortion that would come from assuming the value is zero or the full DL.
- Ensures clean numerical inputs for ML algorithms.
- Geochemical datasets often include values reported as
- Merging Metadata and Geochemistry:
- The geochemistry file contains 76 elements plus Loss on Ignition (LOI).
- The metadata includes key sample information like location, lithology, and alteration.
- Merging these via the Sample Field Number creates a unified dataset for spatial and geochemical analysis.
- Standardizing Formats:
- Numerical columns (e.g., Au, Cu, Pb) are treated as floats.
- Categorical fields (e.g., alteration type) are retained for later interpretation.
- Understanding Analytical Methods:
- The data includes results from multiple methods (XRF, ICP-MS, FA, etc.).
- Knowing the extraction technique used (e.g., Aqua Regia vs. multi-acid digestion) is essential for interpreting element behavior in the near-surface environment.
Step 2: Outlier Detection to Isolate Mineralization Signals
Once the cleaned data is ready, we apply two outlier detection strategies to identify prospective anomalies:
1. IQR Outliers (Univariate)
- Result: In our dataset, ~59% of samples were flagged as IQR outliers for at least one analyte. This is expected in mineral-rich terrains and highlights the value of IQR for rapid anomaly screening.
2. Isolation Forest (Multivariate)
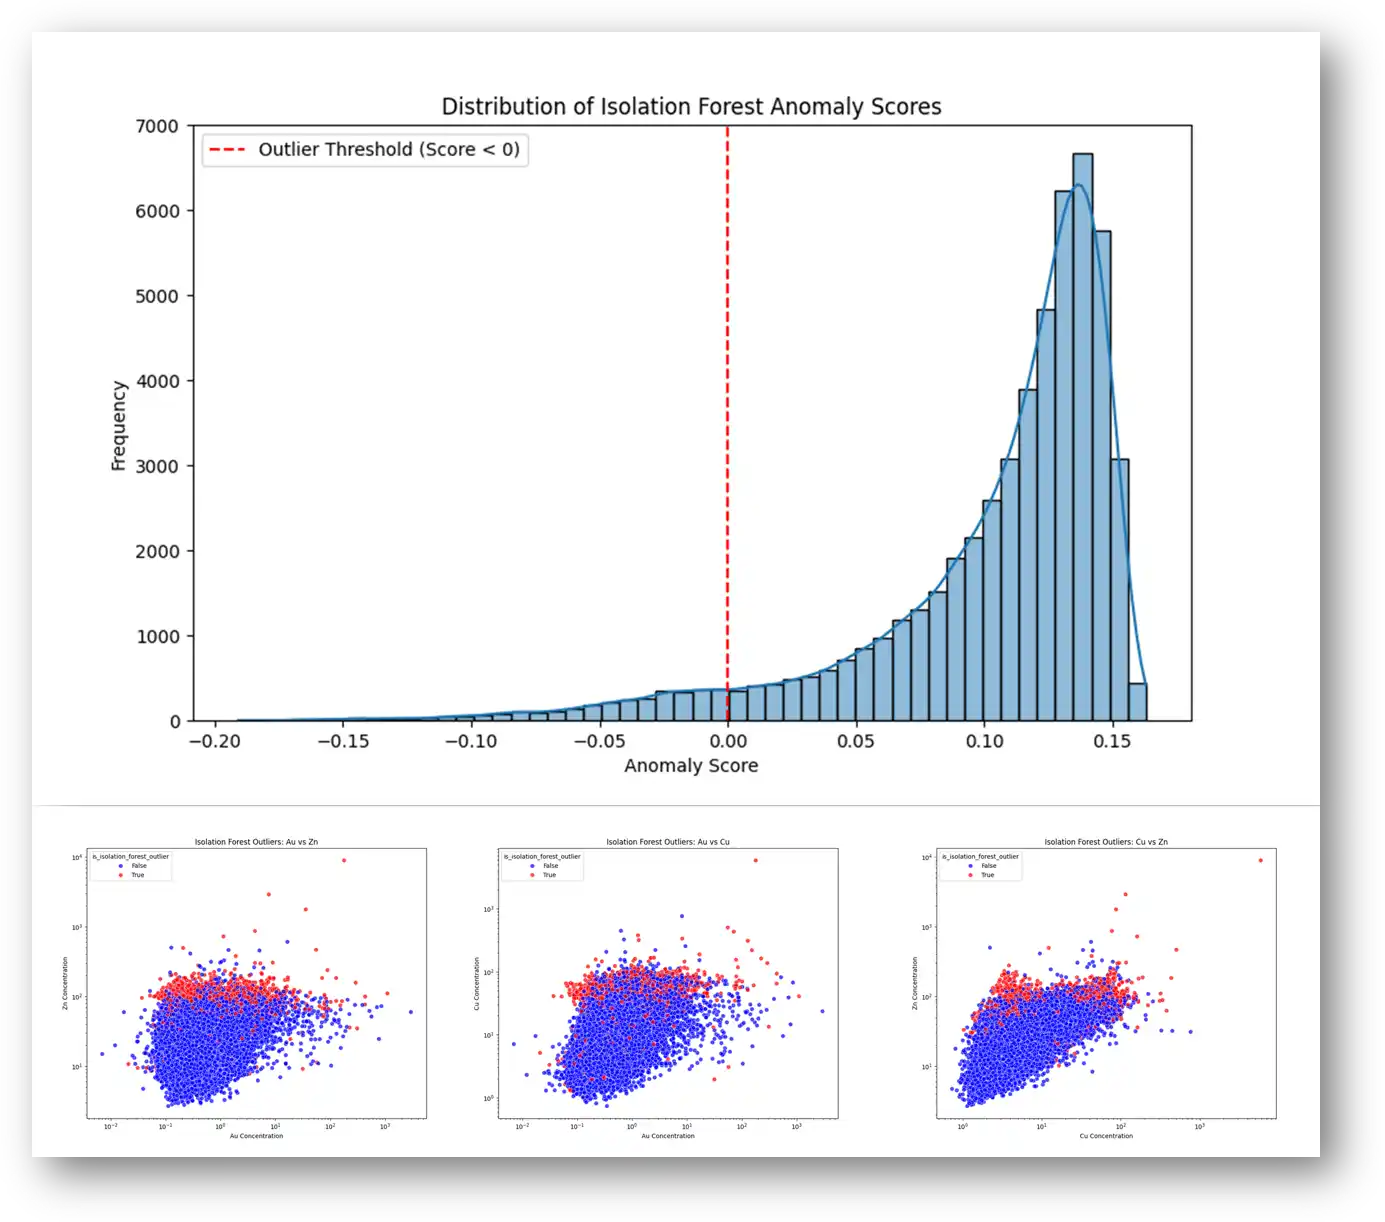
- Result: The model flagged ~5.9% of the samples as multivariate outliers—narrowing our focus to high-interest targets with distinct geochemical fingerprints.
Why Outliers Matter in Geochemical Exploration
In mineral exploration, outliers are not errors—they're often discoveries in disguise.
- An IQR outlier might reflect elevated gold or copper due to surface dispersion or proximity to mineralization.
- An Isolation Forest outlier could uncover an unusual REE-rich alteration zone or a hidden IOCG target that doesn’t conform to expected geochemical patterns.
These anomalies form the foundation for prospectivity modeling, helping geoscientists move from data to discovery more efficiently.
Results From Analysing the GCAS Dataset:
We processed over 53,000 samples from the GCAS dataset. Of these:
- 57 analytes were included in outlier detection.
- Thousands of samples were flagged as having anomalous geochemical signatures.
- These outliers are now being further refined through spatial analysis, geological context, and AI-driven target ranking.
Interpreting the Outliers: What They Actually Tell Us About Mineral Potential
Now that we've applied both IQR and Isolation Forest methods to the cleaned GCAS dataset, the natural next question is: what do these outliers actually represent—and why do we see so many of them?
IQR and Isolation Forest: What the Outliers Reveal
After processing over 53,000 stream sediment samples and applying two complementary outlier detection techniques—IQR for univariate anomalies and Isolation Forest for multivariate anomalies—we observed a significant portion of the dataset flagged as anomalous.
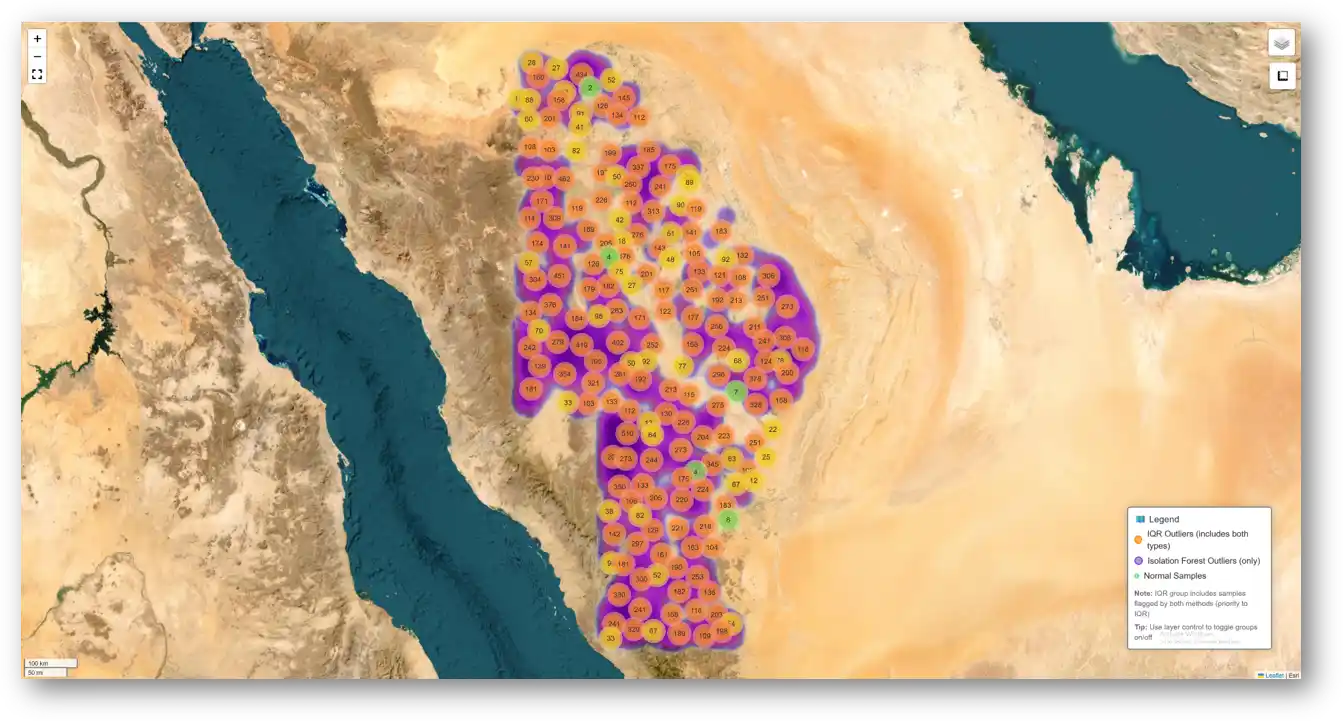
Why So Many IQR Outliers?
The IQR method flagged nearly 59% of samples as outliers for at least one element. At first glance, this seems excessive—after all, how can a majority of samples be “outliers”? The answer lies in the natural skewness of geochemical data.
- Most elements, especially those associated with mineralization like Au, Cu, and Zn, are not normally distributed. Instead, they follow positively skewed or log-normal distributions.
- This means the majority of samples show very low background values, while a small subset displays significantly elevated concentrations—our prospective anomalies.
- Because the IQR method defines thresholds based on the middle 50% of values (which are tightly packed at low concentrations), even moderate enrichment can exceed the upper threshold and be flagged.
So when our map is covered in orange dots (IQR outliers), it’s not a glitch—it’s a statistical reflection of the background vs. anomaly dynamics typical of mineral-rich terrains.
High-Frequency Outlier Elements
Certain elements consistently showed a high proportion of IQR outliers, including:
- Transition metals: Cr, Ni, Cu, Zn — linked to ultramafic rocks and base metal mineralization.
- Precious and critical metals: Au, Pt, Pd, Ag, Mo, Re — direct indicators of mineralization.
- Pathfinders and volatiles: As, Sb, Bi, Cl, S, F — often associated with hydrothermal systems.
- Major elements: SiO₂, Fe₂O₃, Al₂O₃ — may indicate host rock variations or alteration.
These patterns help us link outliers not only to possible ore zones but also to lithological and hydrothermal processes.
Isolation Forest: Multivariate Anomalies That Matter
While IQR flags univariate extremes, the Isolation Forest algorithm isolates complex geochemical fingerprints—combinations of element concentrations that are statistically rare across all dimensions.
- Only 5.88% of samples were flagged as Isolation Forest outliers, making this a more selective filter.
- These samples may not stand out in any single element, but they possess unique, multivariate chemical signatures that suggest unusual geological processes, distinct alteration zones, or hidden mineral systems.
These multivariate anomalies are especially valuable for:
- Prospecting blind targets with no surface expression
- Detecting overlapping or cryptic mineral systems
- Prioritizing targets with a higher probability of geological significance
Visual Integration with Saudi MODS: The Geochemical–Deposit Relationship
Now that we’ve identified both element-specific outliers (IQR) and complex geochemical anomalies (Isolation Forest), the next step is to visualize these patterns spatially in relation to Saudi's mineral occourence (MODS) database. This is where the real exploration value emerges.
What is the MODS?
The Mineral Occurrence Data System (MODS) is a comprehensive geodatabase maintained by the Saudi Ministry of Industry and Mineral Resources. It catalogs known mineral deposits and occurrences across the Kingdom, providing:
- Geographic coordinates of each occurrence
- Deposit type (e.g., prospect, occurrence, working)
- Commodity classification (Major, Minor, Trace)
- Deposit names and metadata
Using QGIS, we’ve overlaid two critical layers:
- Green points: Samples flagged as Isolation Forest outliers—these represent unusual multi-element geochemical fingerprints.
- Pink points: Known mineral occurrences in Saudi Arabia filtered by key commodities (e.g., gold, copper, lithium, rare earth elements).
By analyzing where these layers intersect—or don’t—we can extract actionable geological insights.
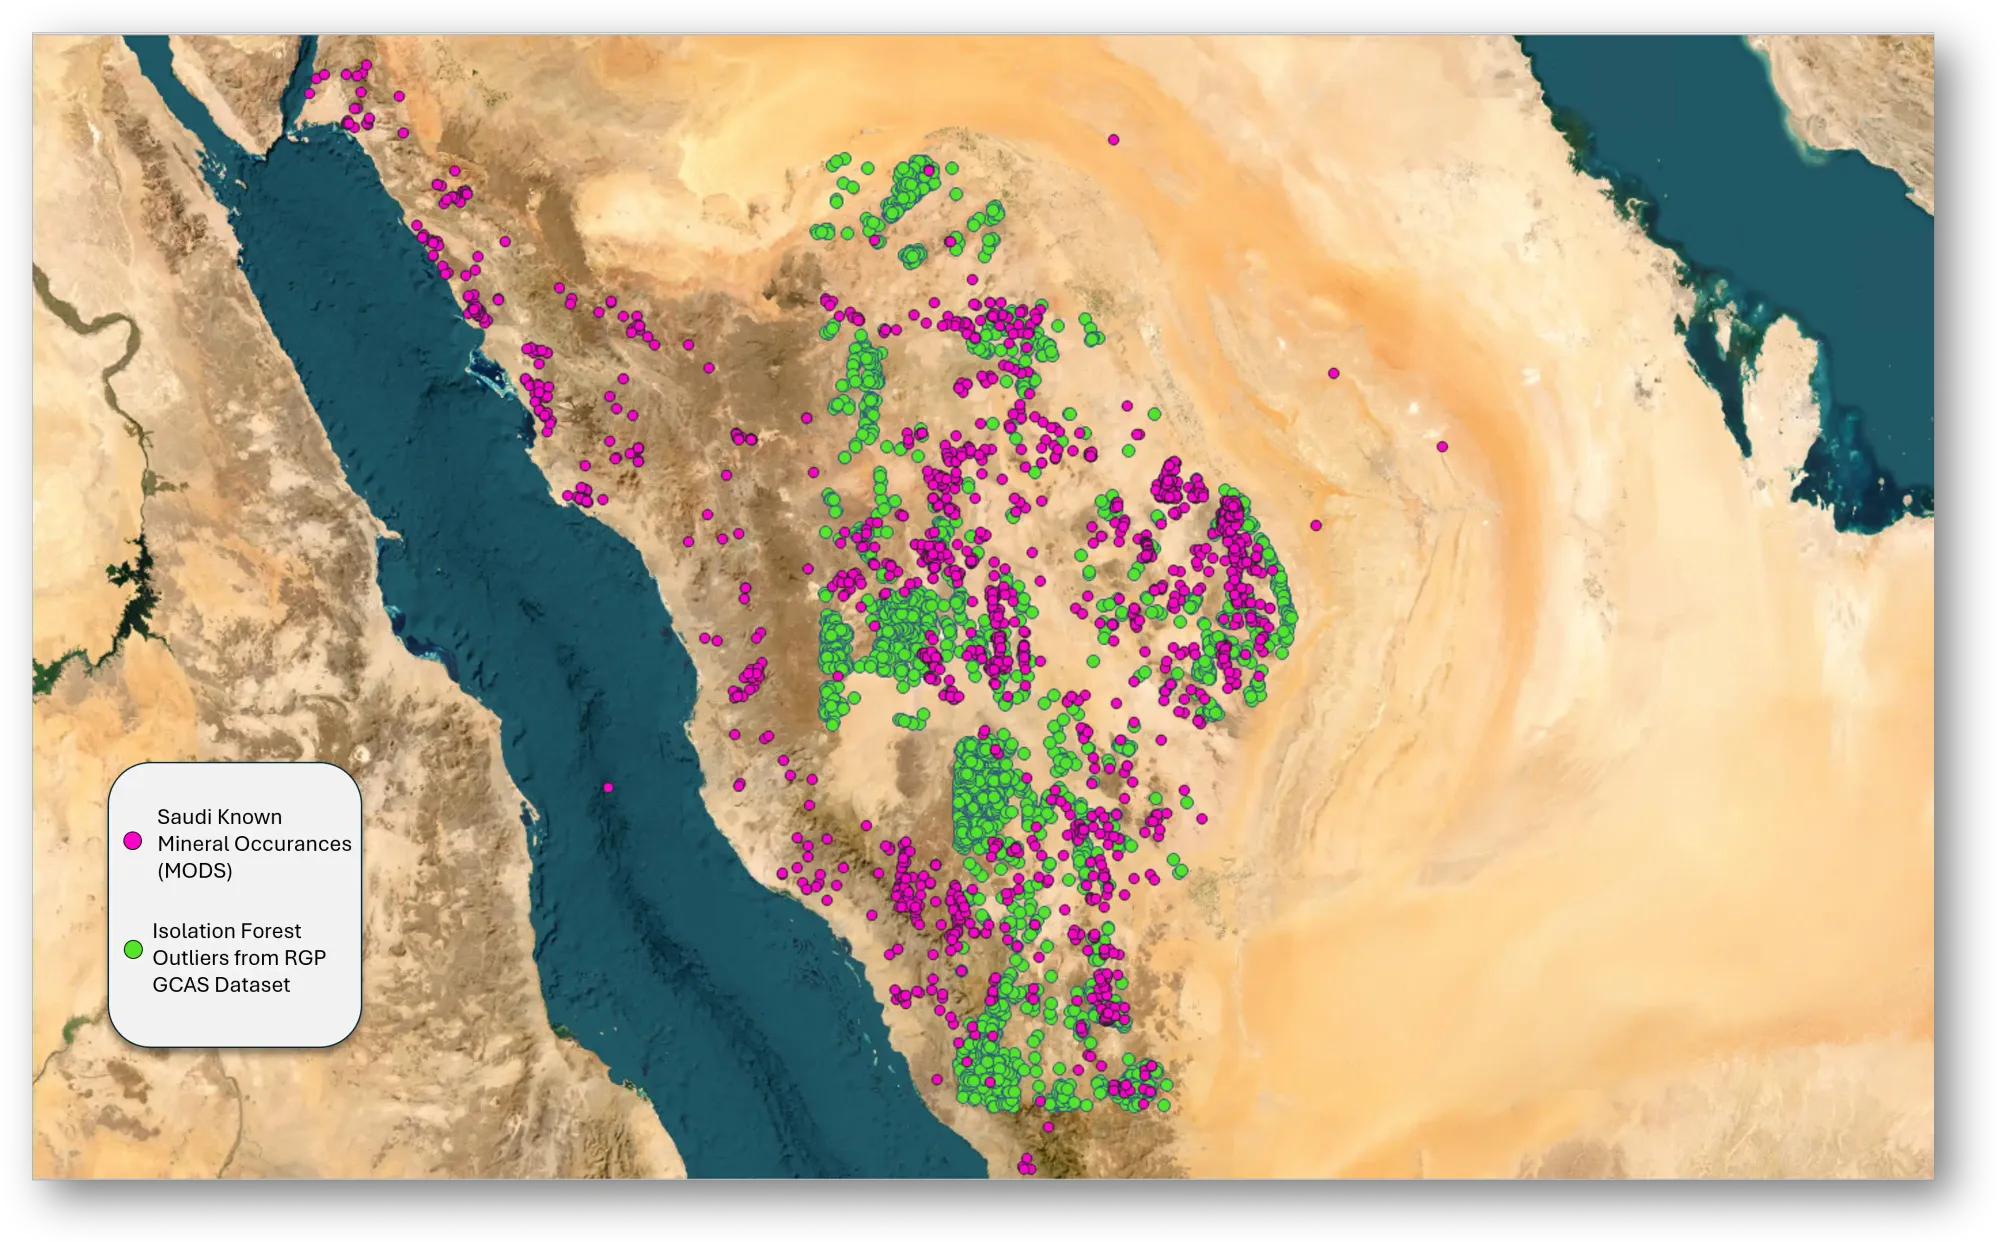
Interpreting the Map: What the Patterns Reveal
1. Green Outliers (Isolation Forest): New Geochemical Leads
The green dots represent sample locations where the Isolation Forest model detected multivariate anomalies. These aren’t just high values for a single element—they’re combinations of trace and major elements that deviate from the norm.
- Green clusters indicate areas where unusual geochemical patterns are concentrated.
- These zones are statistically significant and may represent hidden mineral systems, alteration halos, or entirely new styles of mineralization.
2. Pink Points (Known Mineral Occurrences): Ground Truth
These are confirmed mineral showings or deposits within the Saudi geological database, filtered for economically relevant commodities like:
- Precious metals (Gold, Silver)
- Base metals (Copper, Zinc, Nickel)
- Battery/critical minerals (Lithium, Rare Earth Elements, Manganese)
These serve as real-world benchmarks for interpreting your green anomaly clusters.
Key Observations from the Overlay
High Overlap = Validation of AI Model
In many parts of the Arabian Shield—especially in central and southern zones—there’s a strong spatial correlation between green (anomalies) and pink (known mineral occurrences).
This validates the effectiveness of the Isolation Forest approach in detecting geochemical patterns associated with known mineral systems.
These overlapping zones are:
- High-confidence targets for further validation.
- Ideal areas for infill sampling, trenching, or even first-pass drilling.
Green Clusters Without Known Occurrences = Discovery Potential
Even more exciting are the clusters of green points in areas with no pink mineral occurrences nearby. These are:
- Blind targets—regions with anomalous geochemistry but no known deposits (yet).
- Prime candidates for greenfield exploration and project generation.
In some cases, the anomalies resemble the geochemical signature of known deposits elsewhere, suggesting untapped potential in unexplored parts of the Shield.
Pink Points Without Green = Underrepresented Signatures
Some mineral occurrences do not correspond to green anomalies. This could indicate:
- A different mineralization style not captured well by current element selection or ML parameters.
- Subtle or deeply buried systems where stream sediments don’t reflect the underlying mineralization clearly.
- Sampling density or terrain factors limiting surface geochemical expression.
These gaps highlight areas for model refinement or integration of other datasets (e.g., geology, geophysics) to strengthen interpretation.
After visually identifying alignment between AI-detected geochemical anomalies and known mineral occurrences, we take the analysis a step further—by quantifying that relationship using Saudi Arabia’s official Mineral Occurrence Database System (MODS).
This integration helps us assess the validity of our Isolation Forest model and identify new, blind exploration targets with no known mineralization nearby.
Quantifying Spatial Validation: Do AI-Detected Anomalies Align with Known Deposits?
To determine whether our AI is flagging meaningful geological signals, we conducted a visual proximity analysis:
- Measured the distance from each Isolation Forest outlier to the nearest MODS occurrence
- Tagged each anomaly with:
- Distance to nearest MODS point (in km)
- Name and commodity of that MODS point
- A binary flag:
is_near_mods= True if within a 5 km threshold
Results: How Many Outliers Are "Real"?
Out of 3,122 geochemical anomalies flagged by the Isolation Forest model:
- 751 anomalies (24%) are within 5 km of a known MODS deposit
→ ✅ Validation hits — strong evidence the model is capturing real mineral systems. - 2,371 anomalies (76%) are not near any known occurrence
→ 🟢 Blind outliers — greenfield zones with no recorded mineralization, representing high-potential exploration leads.
This spatial alignment gives us a solid foundation: not only does the model detect known systems, but it also uncovers areas the MODS database hasn’t captured yet.
What Makes These Blind Outliers Important?
These “blind” anomalies are statistically significant outliers with no nearby MODS reference point. They represent:
- Undiscovered deposits
- Extensions of known systems
- AI-prioritized greenfield targets
These targets are particularly valuable in frontier terrains like the Arabian Shield, where historical exploration has been limited.
Geochemical Fingerprinting: From Known Systems to New Discoveries
To further strengthen the connection between blind outliers and potential mineralization, we developed geochemical fingerprints for known deposit types using the MODS-proximal outliers.
Step 1: Build Commodity-Specific Fingerprints
For each group (e.g., "Near Gold Occurrences"), we summarized the median and IQR of key trace elements like Au, Cu, Zn, As, Sb, Bi, Mo, and W. This creates a robust “signature” for each deposit type.
Step 2: Compare Blind Outliers to Known Signatures
We then compared the median element values of blind outliers against each commodity fingerprint.
Example:
If blind outliers show elevated Au, As, and Sb—similar to the "Gold" fingerprint—those blind samples are strong gold targets, despite being located far from known occurrences.
This comparison is not limited to gold—it works across all commodities, including Cu, Zn, Ni, Mo, REEs, and more.
Model Validation Through Commodity Trends
We examined the elemental profiles of outliers near MODS deposits, revealing strong alignment with known geochemical signatures:
| Commodity Group | Characteristic Elements (Median Concentrations) |
|---|---|
| Gold | Au, Cu, Zn, As, Sb, Bi, Mo, W, Ag, Cd, Te |
| Copper | Cu, Zn, Cr, V, Ni, Mn, Ti, Fe, Co |
| Zinc | Zn, Cu, Cr, V, Ni, Mn, Ti, Co |
| Silver | Ag, Au, Cu, Zn, As, Sb, Bi, Mo |
| Nickel | Ni, Cr, Co, Cu, V |
| REE/Thorium | Hf, Zr, Nb, Ta, Y, Th, U, Ce, La |
This validates that:
- The Isolation Forest model reliably captures known deposit types
- Each commodity group has a distinct geochemical fingerprint useful for target generation and classification of blind anomalies
Inferring Commodity Potential in Blind Targets
Armed with known geochemical fingerprints, we then applied a pattern-matching approach to the blind outliers—those with no MODS reference.
Method:
- Removed major oxides (e.g., SiO₂, Al₂O₃) to focus on trace elements
- Calculated median values for each analyte in the blind group
- Compared to known fingerprints using:
- Top Element Overlap (shared top 10 elements)
- Log-ratio similarity (to normalize for magnitude differences)
Each known commodity group received a similarity score, indicating how closely the blind outliers resembled that group’s geochemical signature.
Similarity Score Results: What Do Blind Outliers Most Resemble?
| Rank | Commodity Group | Similarity Score |
|---|---|---|
| 1 | Basalt (host lithology) | 56.84 |
| 2 | Lightweight Aggregates | 55.52 |
| 3 | Clay / Laterite | 55.50 |
| 4 | Marble | 54.34 |
| 5 | Olivine | 53.72 |
| 6 | Copper | 51.91 |
| 7 | Gold | 51.70 |
| 8 | Silver | 50.70 |
| 9 | Zinc | 48.18 |
| 10 | Nickel | 46.41 |
| 11 | Molybdenum | 45.89 |
Interpretation:
- The top scores reflect geological host controls (e.g., basalt, olivine-rich rocks).
- The mid-to-high scores highlight polymetallic potential, especially for:
- Ni-Cr-Co
- Cu-Zn-Au-Ag
- Mo-W-Bi vein systems
- The co-occurrence of Gossan, Pyrite, and Iron reinforces the potential for sulfide-related mineralization.
Visualizing the Outcome: Geochemical Metallic Potential Map
To bring these insights together, we visualized the blind Isolation Forest outliers based on their inferred commodity association. This Geochemical Metallic Potential Map highlights the spatial distribution of high-priority targets, colored by the most likely commodity group (e.g., Ni-Cr-Co, Au-Cu-Zn, Mo-W-Bi).
This map acts as an early-stage targeting layer—transforming statistical anomalies into prospect-scale vectors for exploration. Clusters of outliers with shared geochemical signatures now stand out as tangible exploration leads.
Translating Insights into Exploration Strategy
The ultimate goal of this analysis is to move beyond anomaly detection and into actionable mineral targeting. By linking each blind outlier to the most geochemically similar known deposit type, we can begin to infer the likely commodity association of these unexplored zones.
This enables a new level of precision in greenfield exploration:
- Distinguishing between ultramafic-hosted nickel systems and polymetallic corridors rich in gold, copper, or zinc
- Mapping clusters of blind outliers based on their inferred mineral potential
- Prioritizing anomalies that exhibit the strongest geochemical resemblance to economically significant deposits
In essence, each blind outlier becomes more than just a data point—it becomes a prospect with a likely geological identity, guiding smarter exploration decisions.
Final Recommendations: Prioritizing the Path Forward
✅ Top Priority Targets:
- Blind outliers that:
- Show strong multi-element enrichment (e.g., Cu-Zn-Au-Ni)
- Are spatially clustered
- Match known MODS fingerprints within 5–10% similarity
🔍 Deposit Models to Consider:
- Magmatic Ni-Cu-PGE (in olivine/basalt-rich zones)
- Lateritic Ni-Co (in clay/laterite zones)
- Epithermal or mesothermal Au-Ag (Au + Ag + As + Sb)
- VMS or IOCG (Cu-Zn-Mn-Pyrite-Mo signatures)
Conclusion
By integrating advanced AI models with Saudi Arabia’s national MODS database, we’ve built a fully quantitative workflow for:
- Validating model outputs
- Recognizing new discovery zones
- Inferring commodity potential in greenfield terrain
This isn’t just academic—it’s a practical exploration framework. These results offer a ranked, data-driven map of your highest-value targets—ready for prioritization, prospecting, and drilling.
Bring your own geochem data into the RadiXplore workflow
Contact us to get started with spatial AI insights
Get In Touch