Could RadiXplore’s AI Platform Have Identified the Blue Spec Antimony Deposit in the 1970s?
The Blue Spec gold and antimony mine, located about 30 kilometers east-northeast of Nullagine, was acquired by Anglo American in the mid-1970s primarily for gold mining. This region has a rich exploration history dating back to the late 1800s, with extensive documentation available in historica...

The Blue Spec gold and antimony mine, located about 30 kilometers east-northeast of Nullagine, was acquired by Anglo American in the mid-1970s primarily for gold mining. This region has a rich exploration history dating back to the late 1800s, with extensive documentation available in historical reports. Within these records lie the geological signatures that suggest the presence of antimony.
But could RadiXplore’s AI platform have identified these signs earlier? Here’s how we can test this:
Analyze Historical Documents: Review documents from before the 1970s for geological signatures indicative of antimony, aiming to identify early clues of the Blue Spec deposit.
Validate Potential Findings: Conduct a rapid desktop review to cross-reference and validate any findings by identifying commercially viable grades of antimony within these historical documents.
Expand the Search: Utilize the validated geological signature to search across the entire WAMEX repository for similar antimony signatures.
Analyze Historical Documents:
To begin this process, we must first ask: What exactly is the geological signature of antimony? How can it be described in terms of geological setting, mineralization, and structural features?
Geological Setting:
Sedimentary rocks: Shale, chert, carbonate
Structural features: Fold, fault, shear zone
Mineralization:
Precious and base metals: Gold, silver, zinc, lead
Antimony minerals: Stibnite, valentinite, berthierite
Associated minerals: Arsenopyrite, bismuthinite, tetrahedrite
Alteration:
To search for an antimony analogue using RadiXplore, we can leverage our Hybrid Extractive Search Module, NerdSearch. This powerful tool combines the precision of keyword searches with the contextual understanding of vector-based searches, making it ideal for detecting mineral signatures within unstructured text.
To learn how to construct a NerdSearch query, simply sign up for a free RadiXplore account and explore our knowledge base. Here’s what the geological signature for antimony looks like when translated into a NerdSearch query:
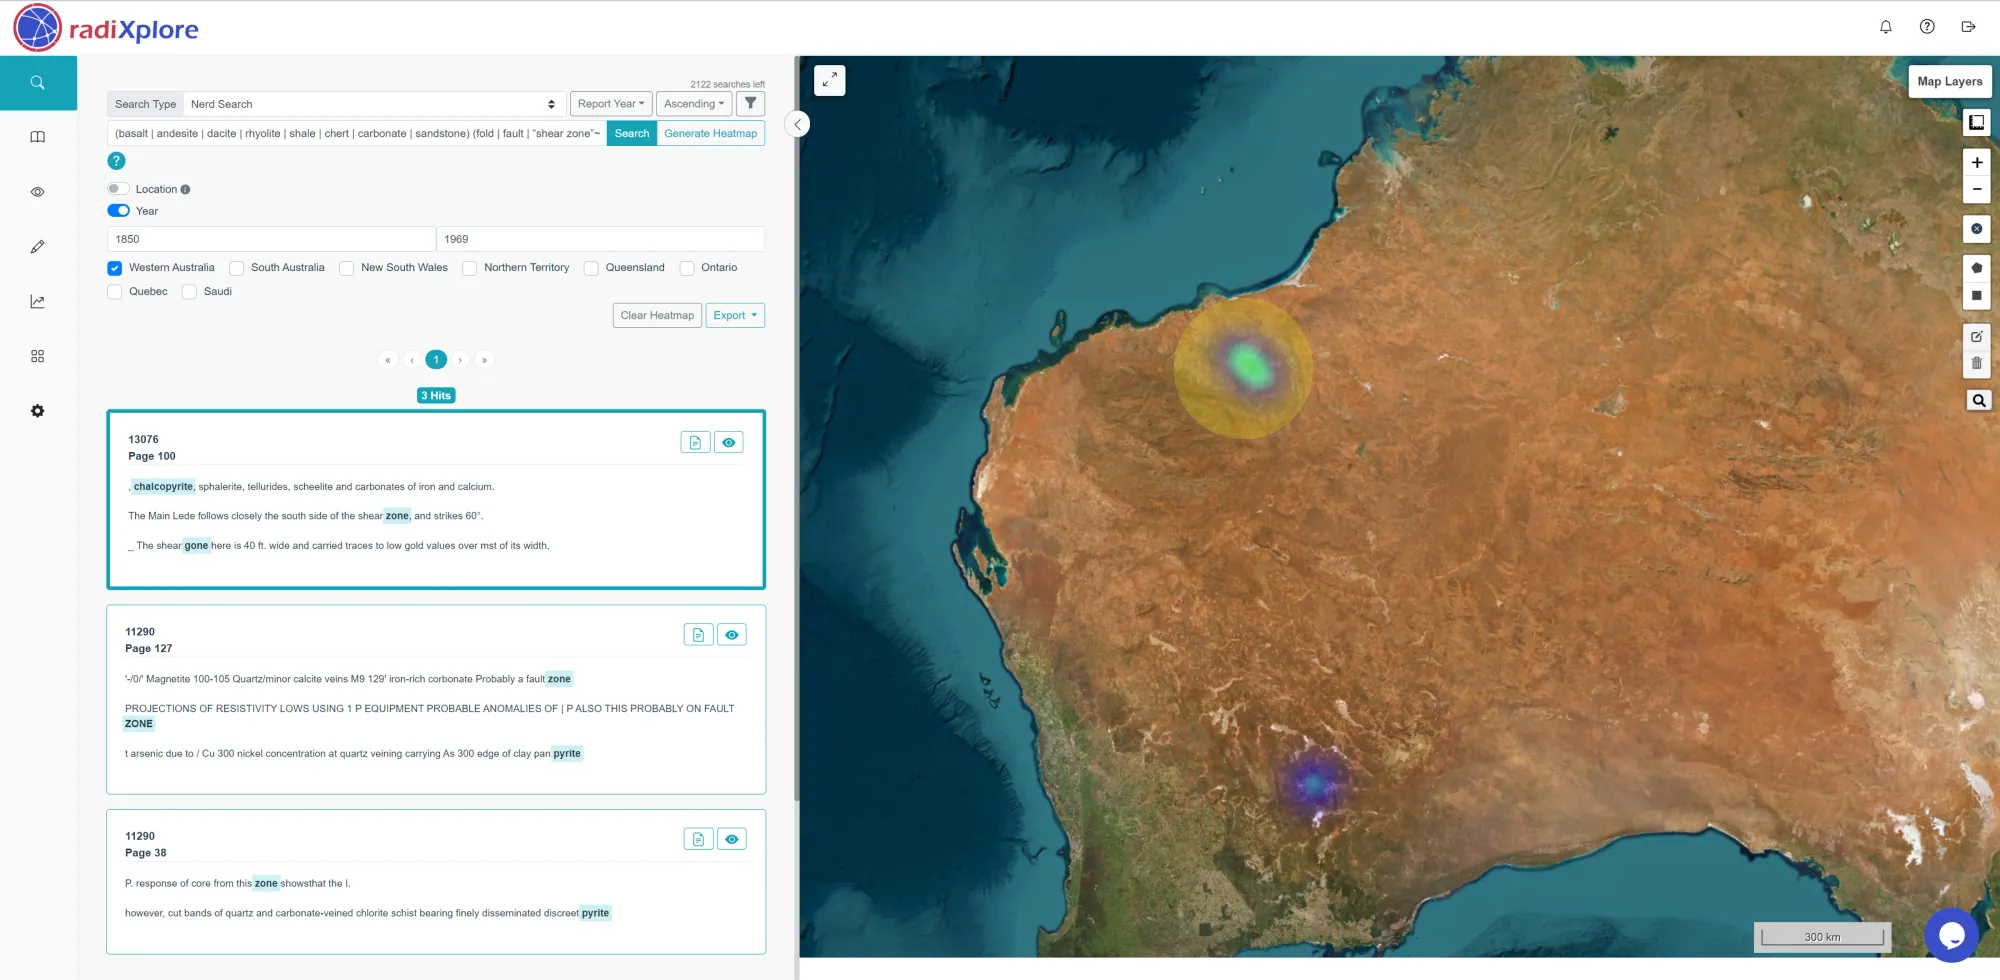
(basalt | andesite | dacite | rhyolite | shale | chert | carbonate | sandstone) (fold | fault | “shear zone”~5) (chalco* | sphalerite | galena | pyr*) (gold | silver | zinc | lead) (stibnite | valentinite | berthierite)
Before running this query, we should apply a year filter to focus on documents from before 1970. This allows us to effectively "turn back the clock" to a time before Anglo American acquired the mine.
Here are the results from our search-
The area around the Blue Spec mine lights up, along with a separate hotspot to the south. Thi Blue Spec hotspot corresponds to a report by Cundill, Meyers & Associates Pty Ltd from 1968, which details their exploration activities for copper and nickel in the region.
Here is an extract of the page, from that report which gave us that hit:
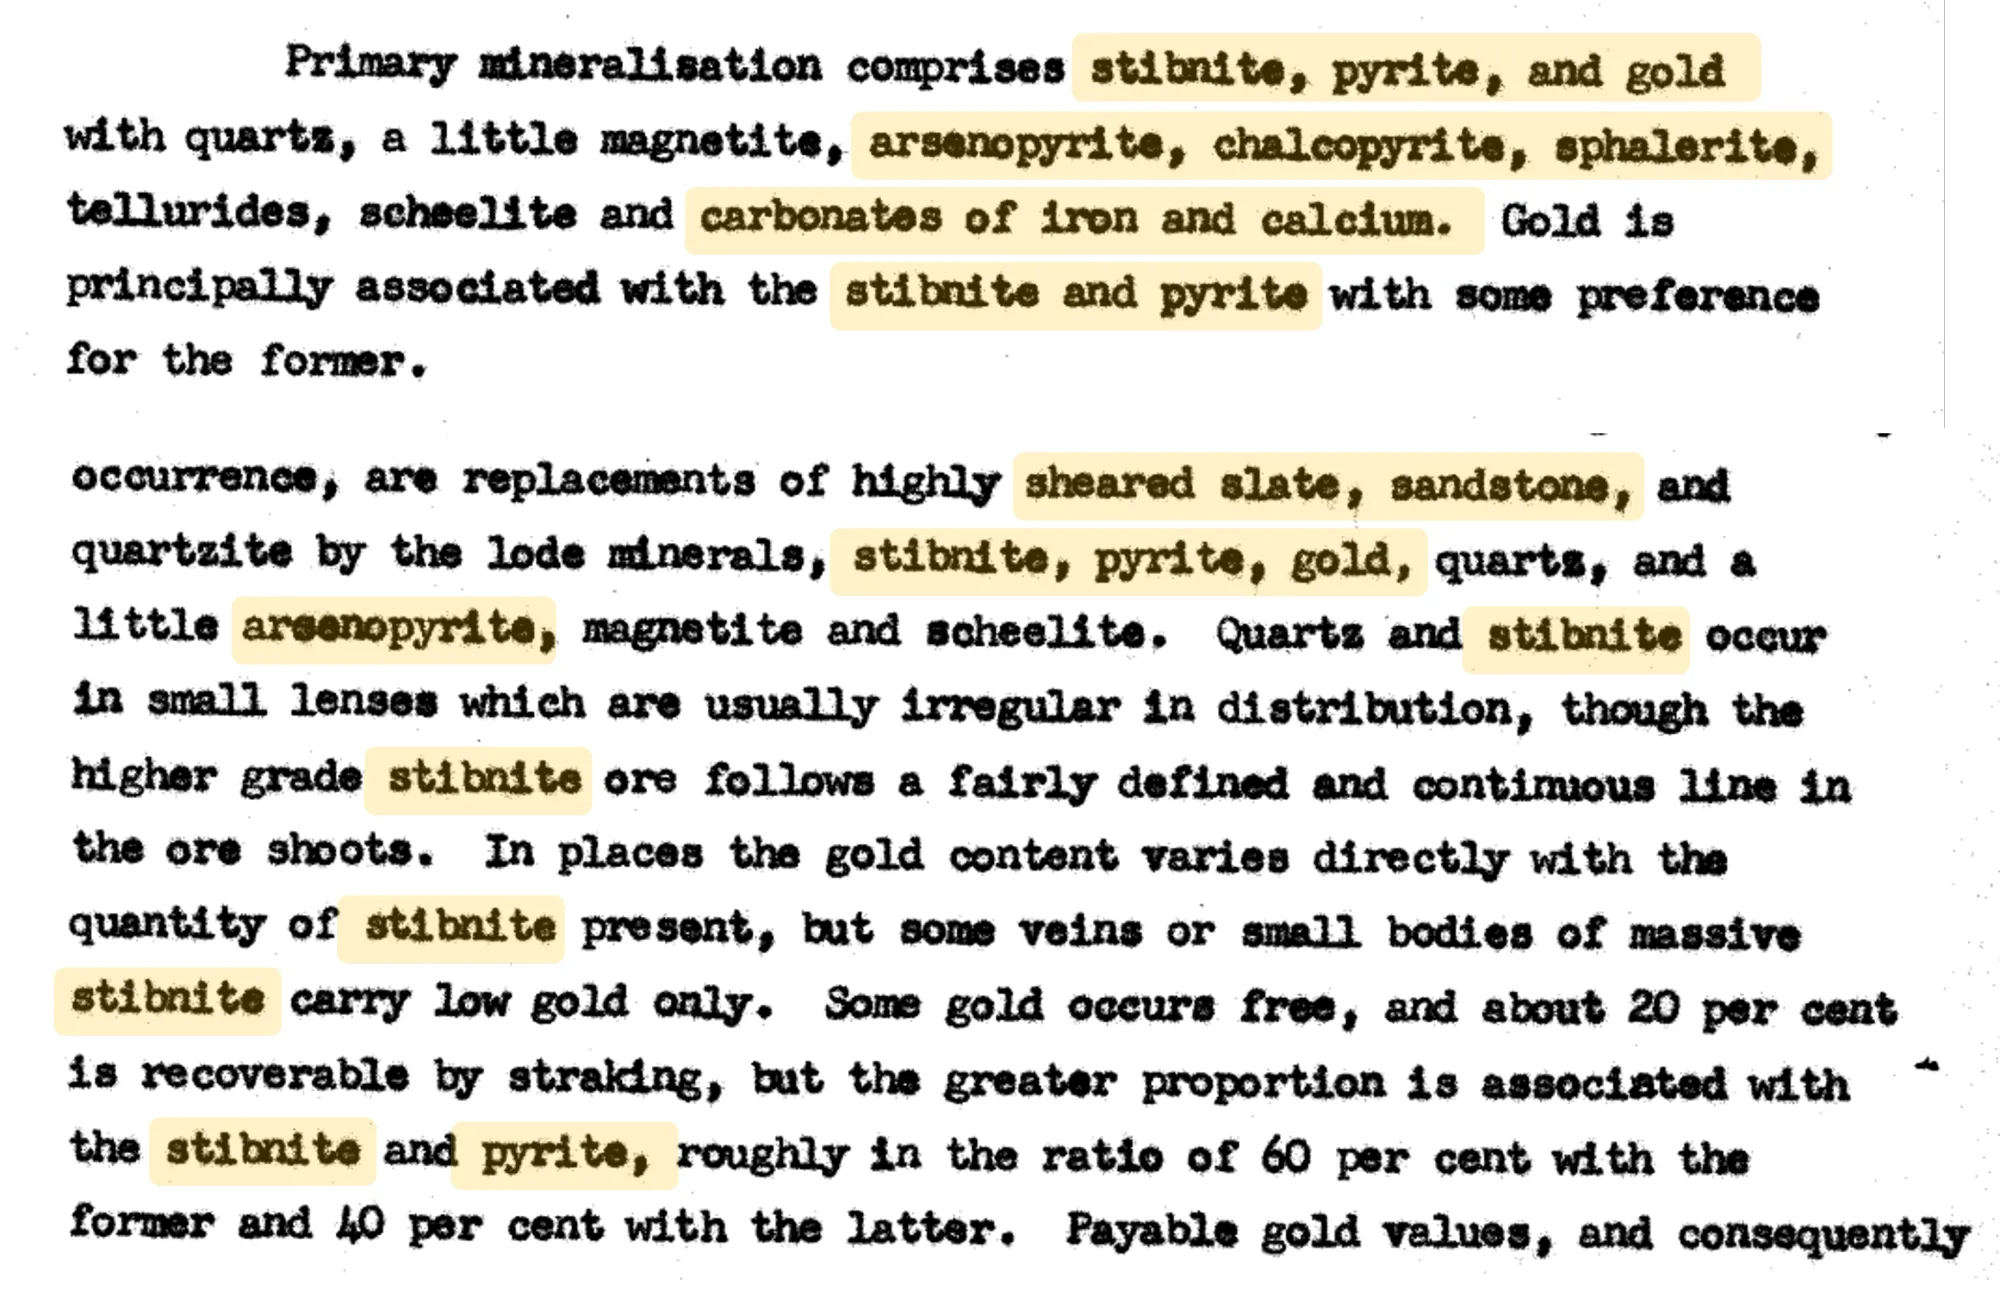
This text is indeed representative example of an antimony deposit.
Key Indicators of Antimony Mineralization:
Stibnite: The explicit mention of stibnite, a common antimony mineral, is a strong indicator of an antimony deposit.
Gold Association: The text notes that gold is primarily associated with stibnite, suggesting a potential correlation between the two minerals.
Hydrothermal Alteration: The mention of sheared slates, sandstones, and quartzites suggests that hydrothermal alteration played a role in the formation of the deposit.
Shear Zone: The deposit is located within a shear zone, which provides a pathway for hydrothermal fluids to circulate and deposit minerals.
RadiXplore's GeoAI successfully identified a report that may indicate the presence of a potential antimony deposit.
Validate Potential Findings
The most accurate way to validate our findings is to conduct fieldwork and test samples, but this approach is also the most costly. Alternatively, we could search through historical documents for reported antimony assays—a time-consuming process that could take days if done manually. However, with RadiXplore, this task can be completed in just a few minutes.
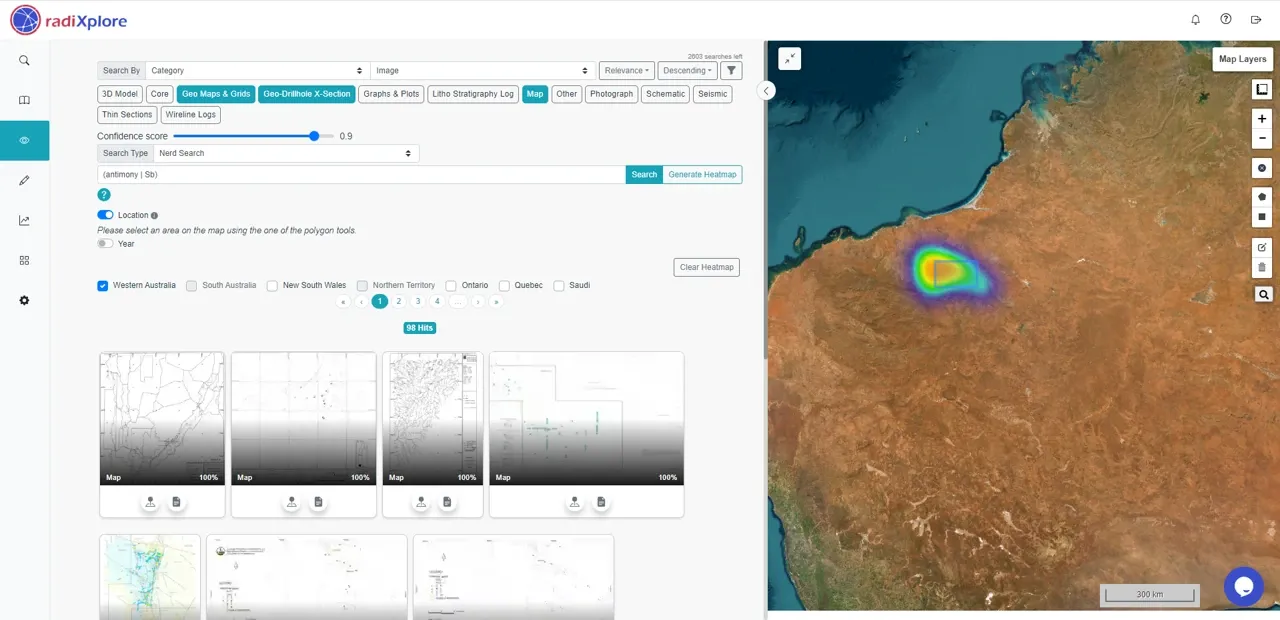
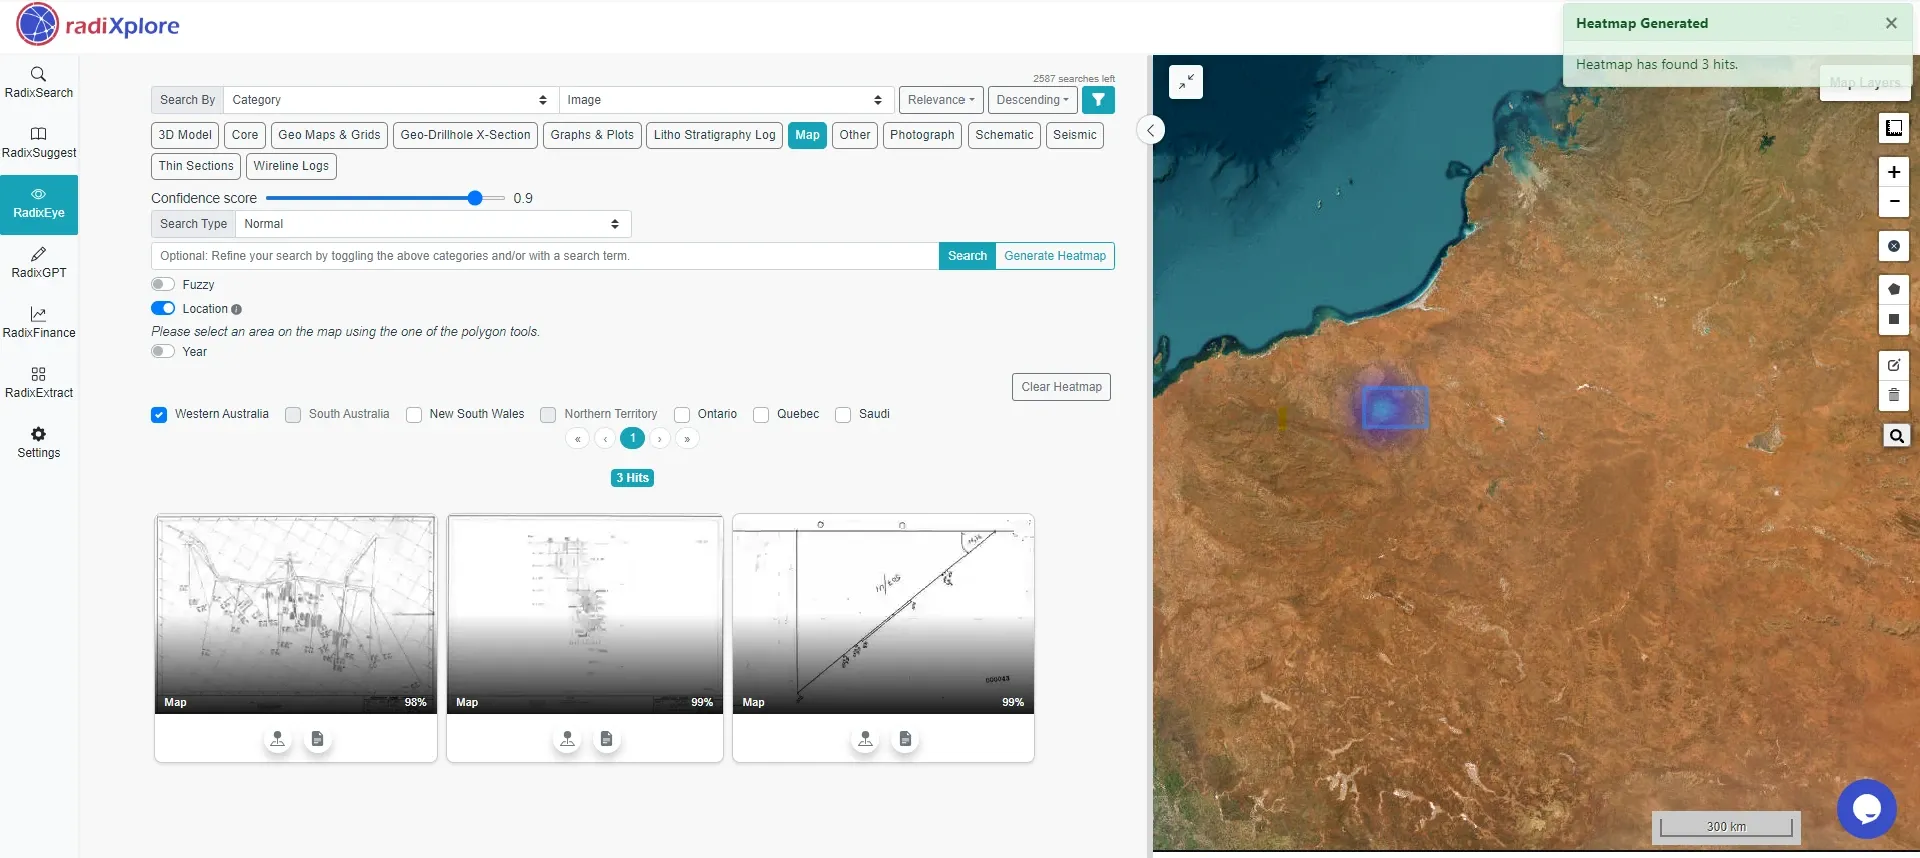
By using RadiXplore's RadixEye module, which employs proprietary geoscience computer vision models, we can efficiently extract and analyze images within documents. We start by drawing a bounding box around our area of interest and instruct RadixEye to search for maps, grids, and geological sections that specifically mention antimony assays.
It identifies 98 images.
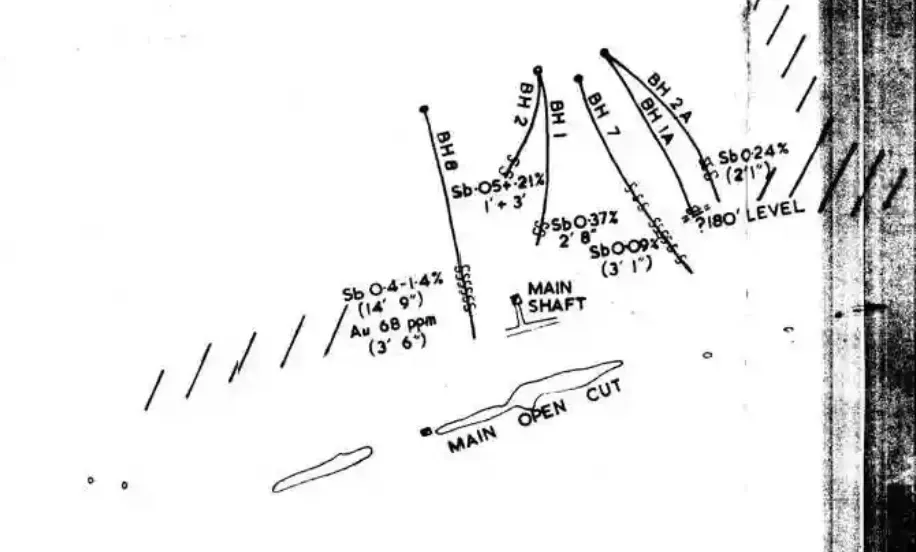
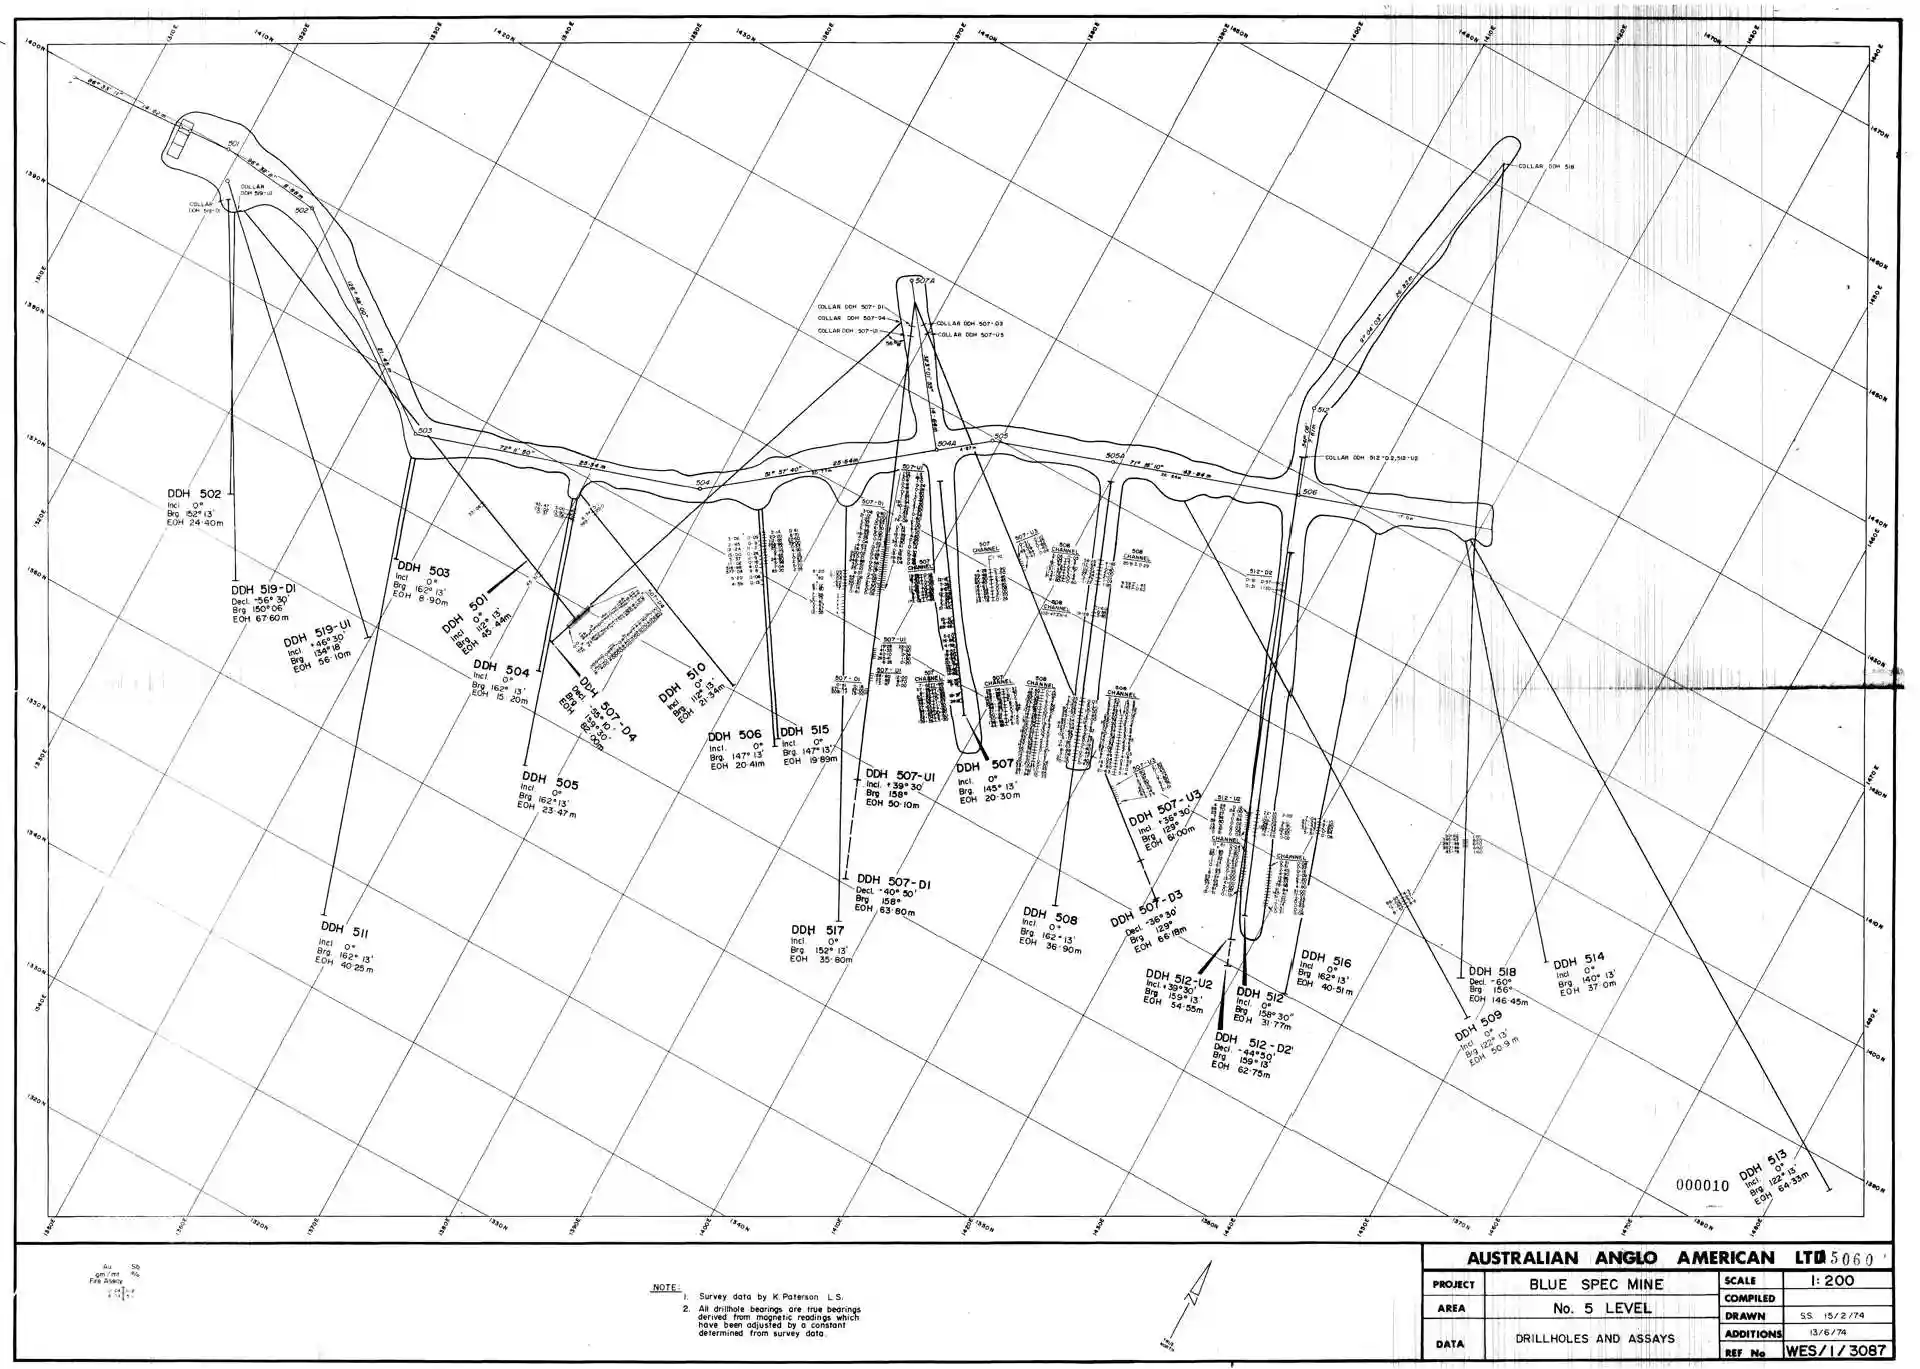
On the very first page, we identify a borehole plan, correctly classified by the AI as a map (since a plan can also be considered a map).
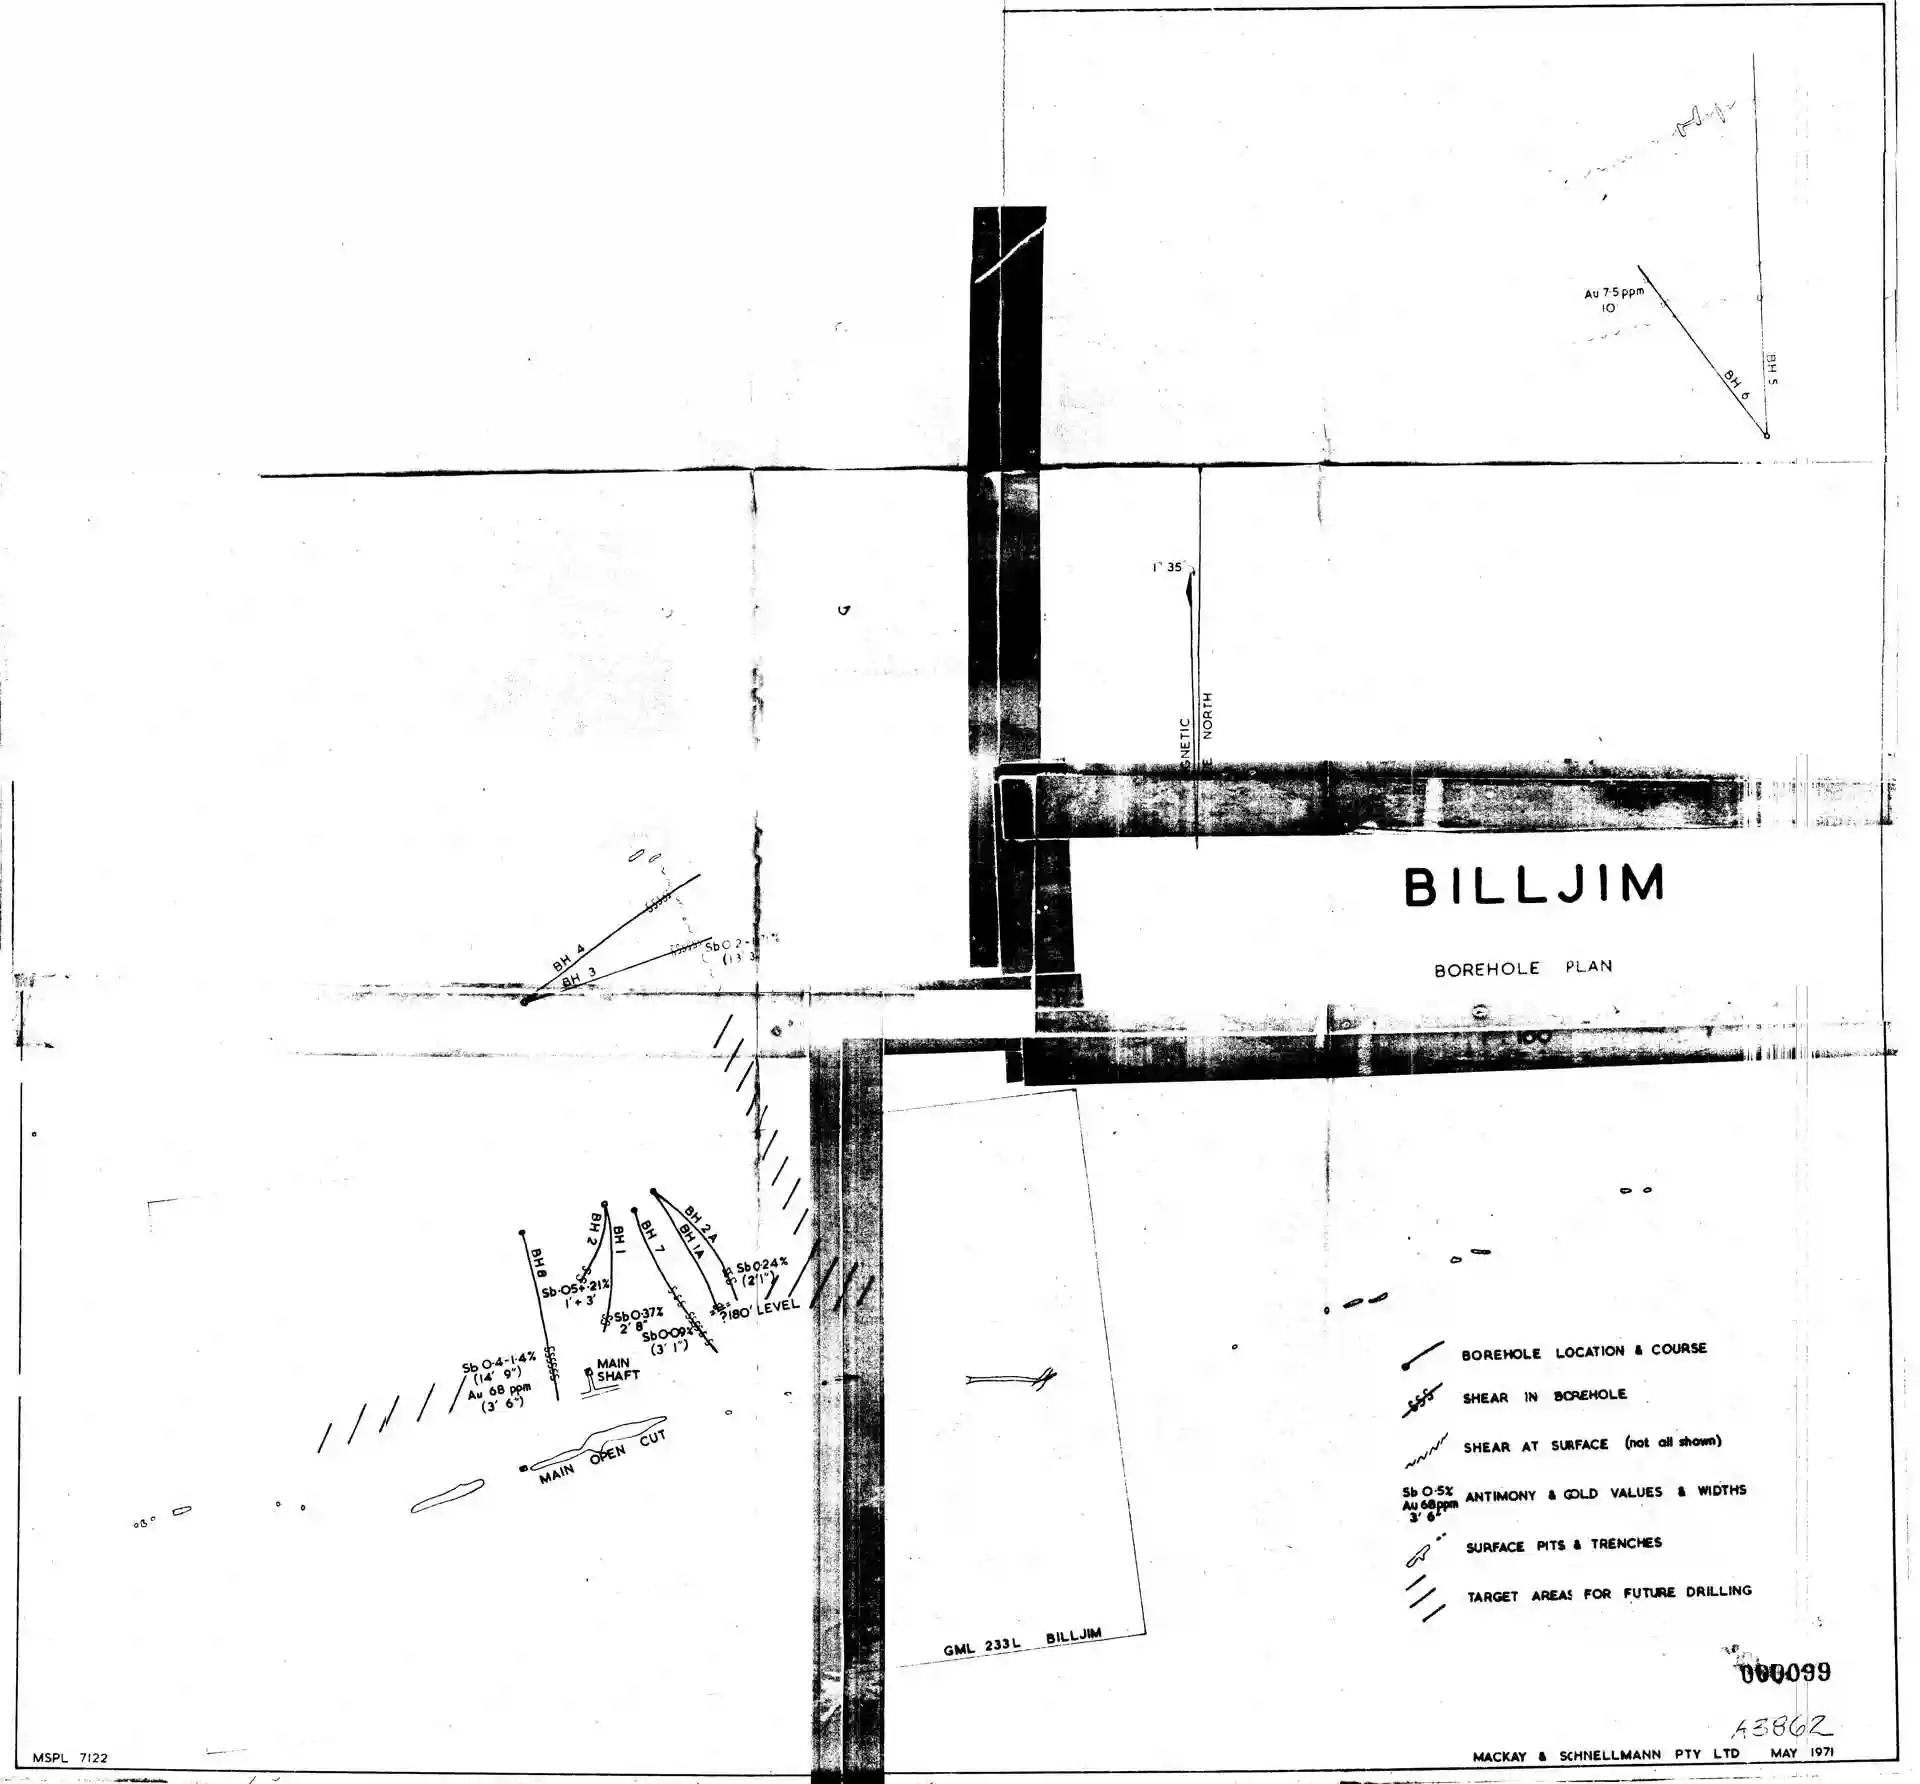
But where is the antimony? Zooming in, you can see antimony concentrations of up to 1.4% reported here.
How do we identify the XY location for this sample?
Can we search through the tables to find the sample number, XY location, and other critical details related to this assay sample? Searching for numbers within images of tables can be challenging, especially since the relevant information is often found in headers, and the assay units might or might not be adjacent to the values. This is where NerdSearch proves invaluable.
By combining the capabilities of RadixSearch's NerdSearch with the image recognition power of RadixEye, we can effectively search for images of tables within documents in our selected area of interest (AOI). We look for terms like "Antimony" or "Sb" with the number "1.4" followed by any additional characters, using an asterisk * to represent any following text (e.g., 1.4*).
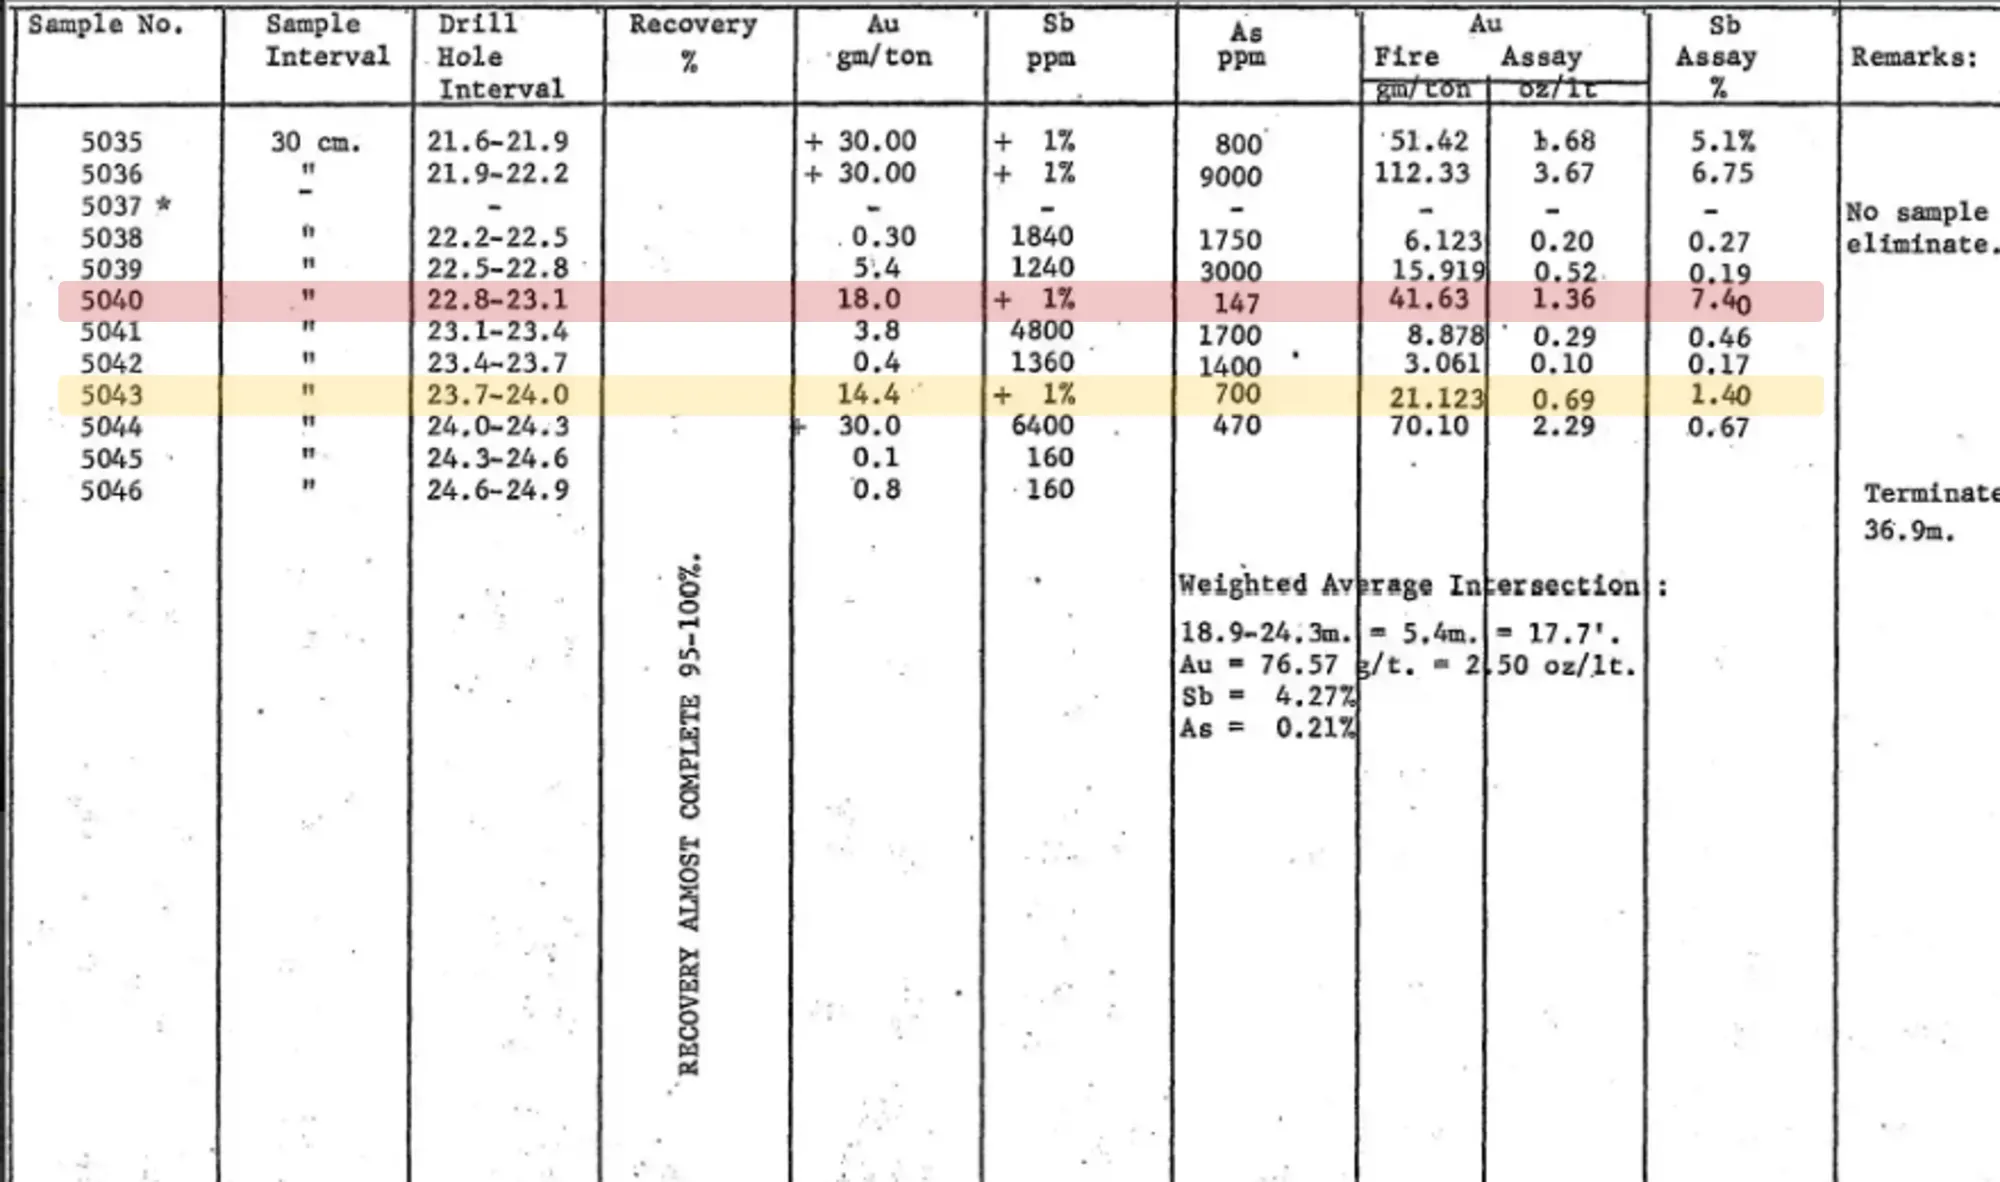
Here’s what we find:
Upon reviewing the table, we found that sample number "5043" corresponds to a 1.4% Sb assay. Additionally, we identified another sample, "5040," which contains 7.40% Sb!
While, we were still not able to locate the location infomation related to the assay, we found the sample numbers. We can use these sample numbers and use RadiXplore to restrict our search to just this document.
Searching for the sample number within the tables of this document yielded no results. If the location wasn't tabulated, could it have been mapped? RadixEye can easily help answer this question.
RadixEye identified three maps within this report.
Opening this map revealed that it includes all the sample numbers. Georeferencing this map—though a complex task—would provide the precise locations of the samples.
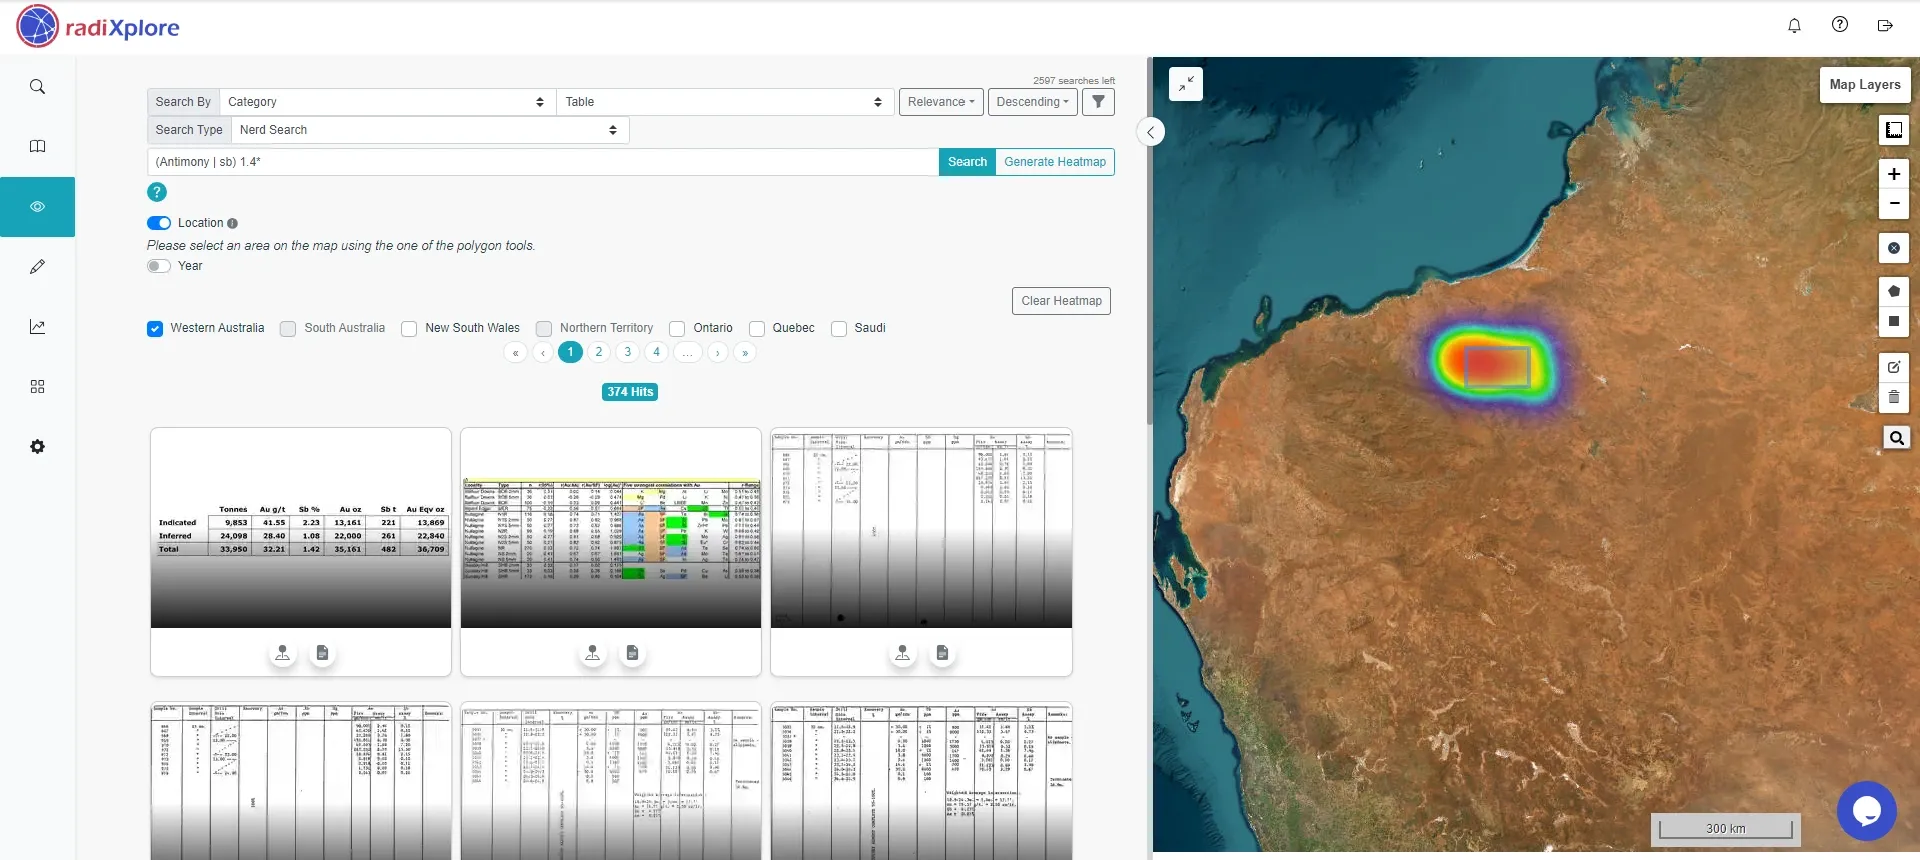
Expand the Search
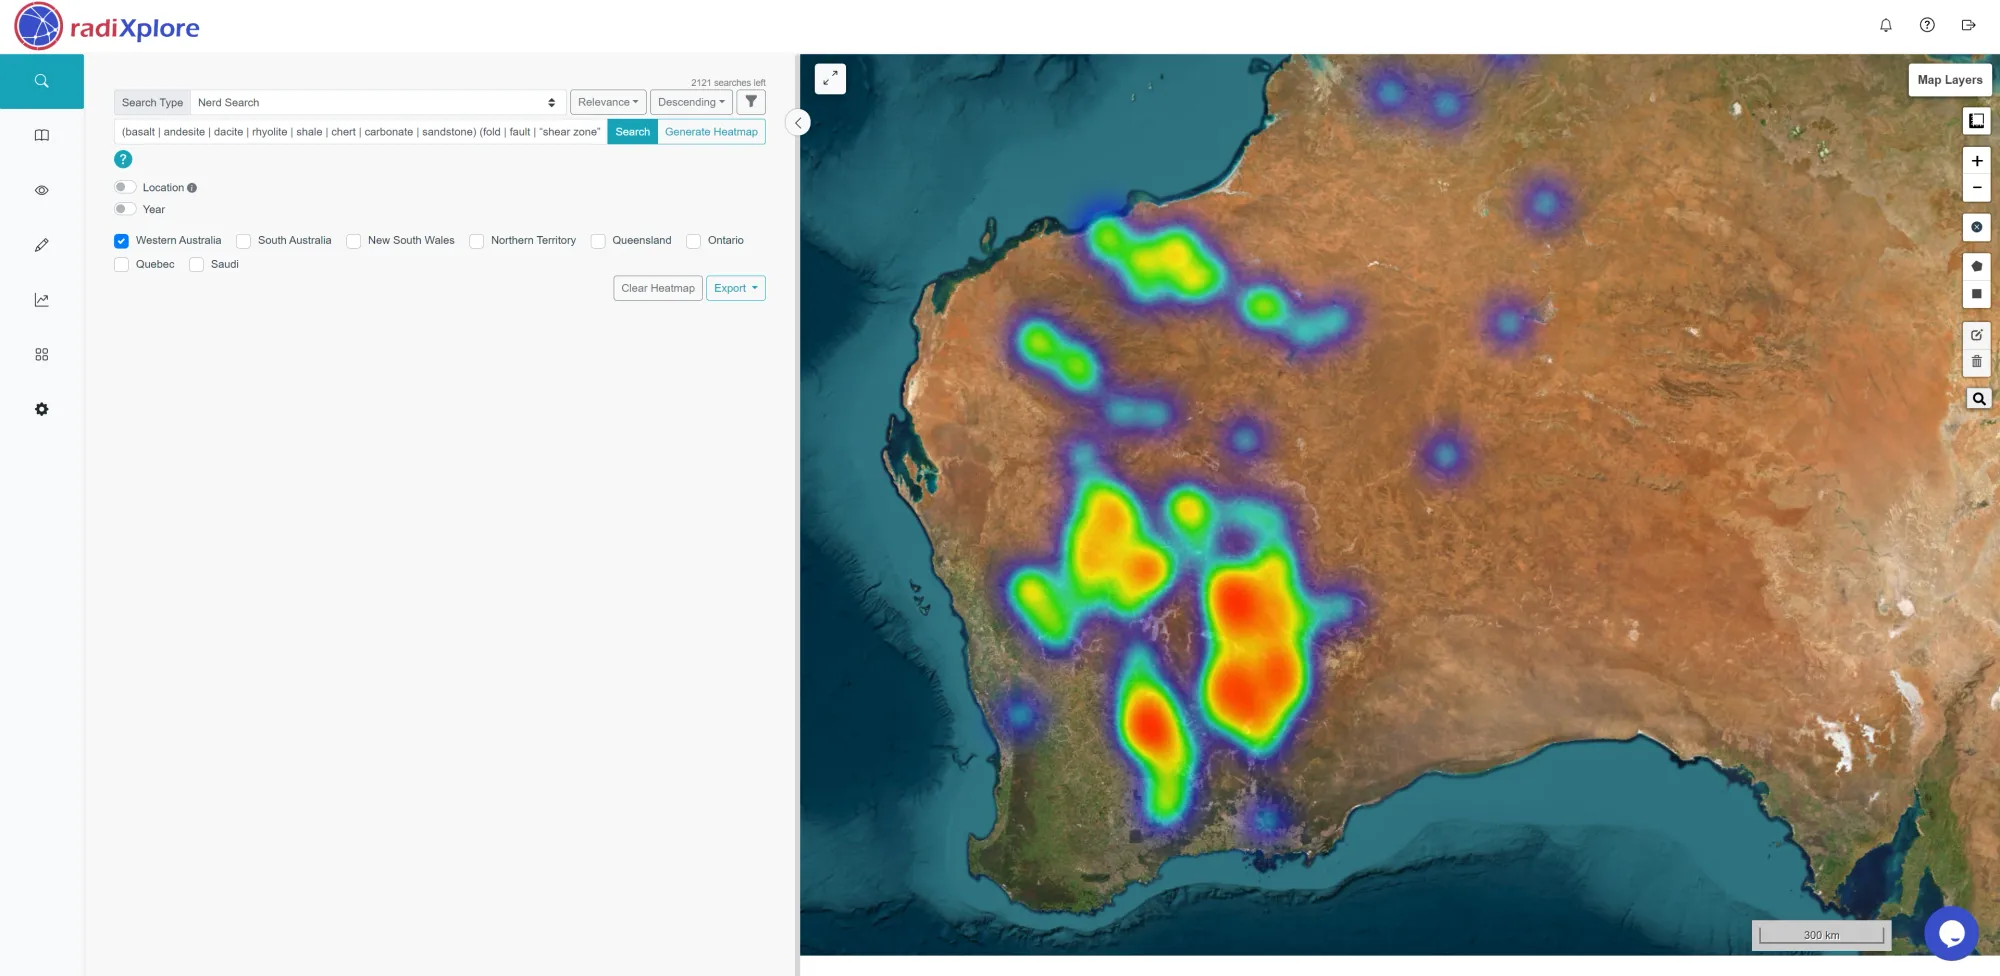
Finally, after validating our NerdSearch query, can we use it to identify potential antimony mineralization elsewhere?
Removing the year filter from our initial query generates a heat map that shows the antimony analogue across WAMEX documents, displayed geospatially. This means that each hotspot on the map could represent a potential antimony deposit, awaiting validation and possible discovery!
Discover the Hidden Potential of Antimony Deposits with RadiXplore!
Unlock the power of RadiXplore’s advanced AI tools to uncover hidden antimony deposits in historical data. Our Hybrid Extractive Search Module, NerdSearch, combined with RadixEye’s image recognition capabilities, can swiftly analyze documents and maps to identify promising sites.
Don’t let valuable opportunities slip through the cracks. Sign up for a free RadiXplore account today or Contact us today to schedule a private demo and start exploring the wealth of historical data with ease. Validate potential deposits, streamline your search process, and stay ahead in the geoscience field.
Explore, validate, and discover—get started with RadiXplore now!