The Unadvertised Garage Sale: Mining M&A Targets at PDAC 2026
RadiXplore analyzed 1,734 projects at PDAC 2026 using its Strategic Asset Index, identifying 647 Prime and Strong mining M&A targets. Explore the interactive deal map and uncover divestment pressure, portfolio misalignment, and high-probability acquisition opportunities.


RadiXplore Strategic Asset Index (SAI) Analysis of 1,734 Projects
Executive Summary: The Hidden Mining M&A Market at PDAC 2026
PDAC 2026 is widely positioned as the mining industry's premier capital-raising forum.
Our analysis indicates it is also something else: one of the largest concentrated mining M&A marketplaces in the world.
RadiXplore analyzed 1,734 projects presented at PDAC 2026 using the Strategic Asset Index (SAI), a quantitative framework designed to detect structural portfolio misalignment and forward divestment probability.
37.3% of all projects analyzed (647 of 1,734) qualify as Prime or Strong divestment candidates.
More than one-third of PDAC 2026 projects exhibit measurable divestment pressure.
This does not imply geological weakness. It reflects capital discipline, portfolio rationalization, and increasing focus on jurisdictional and commodity specialization.
For corporate development teams, mining private equity, and mid-tier producers, this represents concentrated off-market deal flow.
Methodology: Quantifying Divestment Risk in Mining Portfolios
Each project was evaluated using RadiXplore's proprietary SPOTlight framework, generating a Divestment Score between:
- 0.0 - Core strategic asset
- 1.0 - Prime divestment candidate
A 1.0 score signals structural portfolio tension typically driven by:
- Country mismatch relative to corporate focus
- Commodity misalignment
- Geographic isolation from core infrastructure
- External capital dependency
A 1.0 Divestment Score is not a valuation call. It is a structural signal.
The objective is not to assess project quality. It is to quantify probability of strategic separation.
Model Validation: Predicting Mining Divestments Before Announcement
To ensure signal integrity, historical transactions were used as a ground-truth validation layer.
Across known divestments, the Strategic Asset Index identified 42% of transactions prior to public announcement.
In mining M&A, a 42% forward detection rate is materially significant given political, financing, and operational complexity.
Case examples include:
- Valkea Resources - Yeungroon Project (Australia)
Flagged 1.0 due to country mismatch relative to Finnish core.
Outcome: 80% earn-in JV; strategic refocus on Lapland. - Velocity Minerals - Zlatusha Project (Bulgaria)
Flagged 1.0 due to geographic isolation from core hubs.
Outcome: Divested in 2025. - Starcore International - Ajax Project (Canada)
Flagged 1.0 due to jurisdictional misalignment.
Outcome: Spun out in 2026.
The data demonstrates measurable predictive signal in mining acquisition and divestment cycles.
Interactive Mining M&A Database: The Strategic Opportunity Matrix
RadiXplore mapped all 1,734 PDAC 2026 projects into an interactive mining M&A intelligence layer. Click the image to access the Interactive Mining M&A Matrix.
How to Use the Matrix
Filter by Company or Project
Isolate individual portfolios to assess structural alignment.
Commodity Isolation
Identify concentration risk or non-core exposure across lithium, precious metals, base metals, and battery metals.
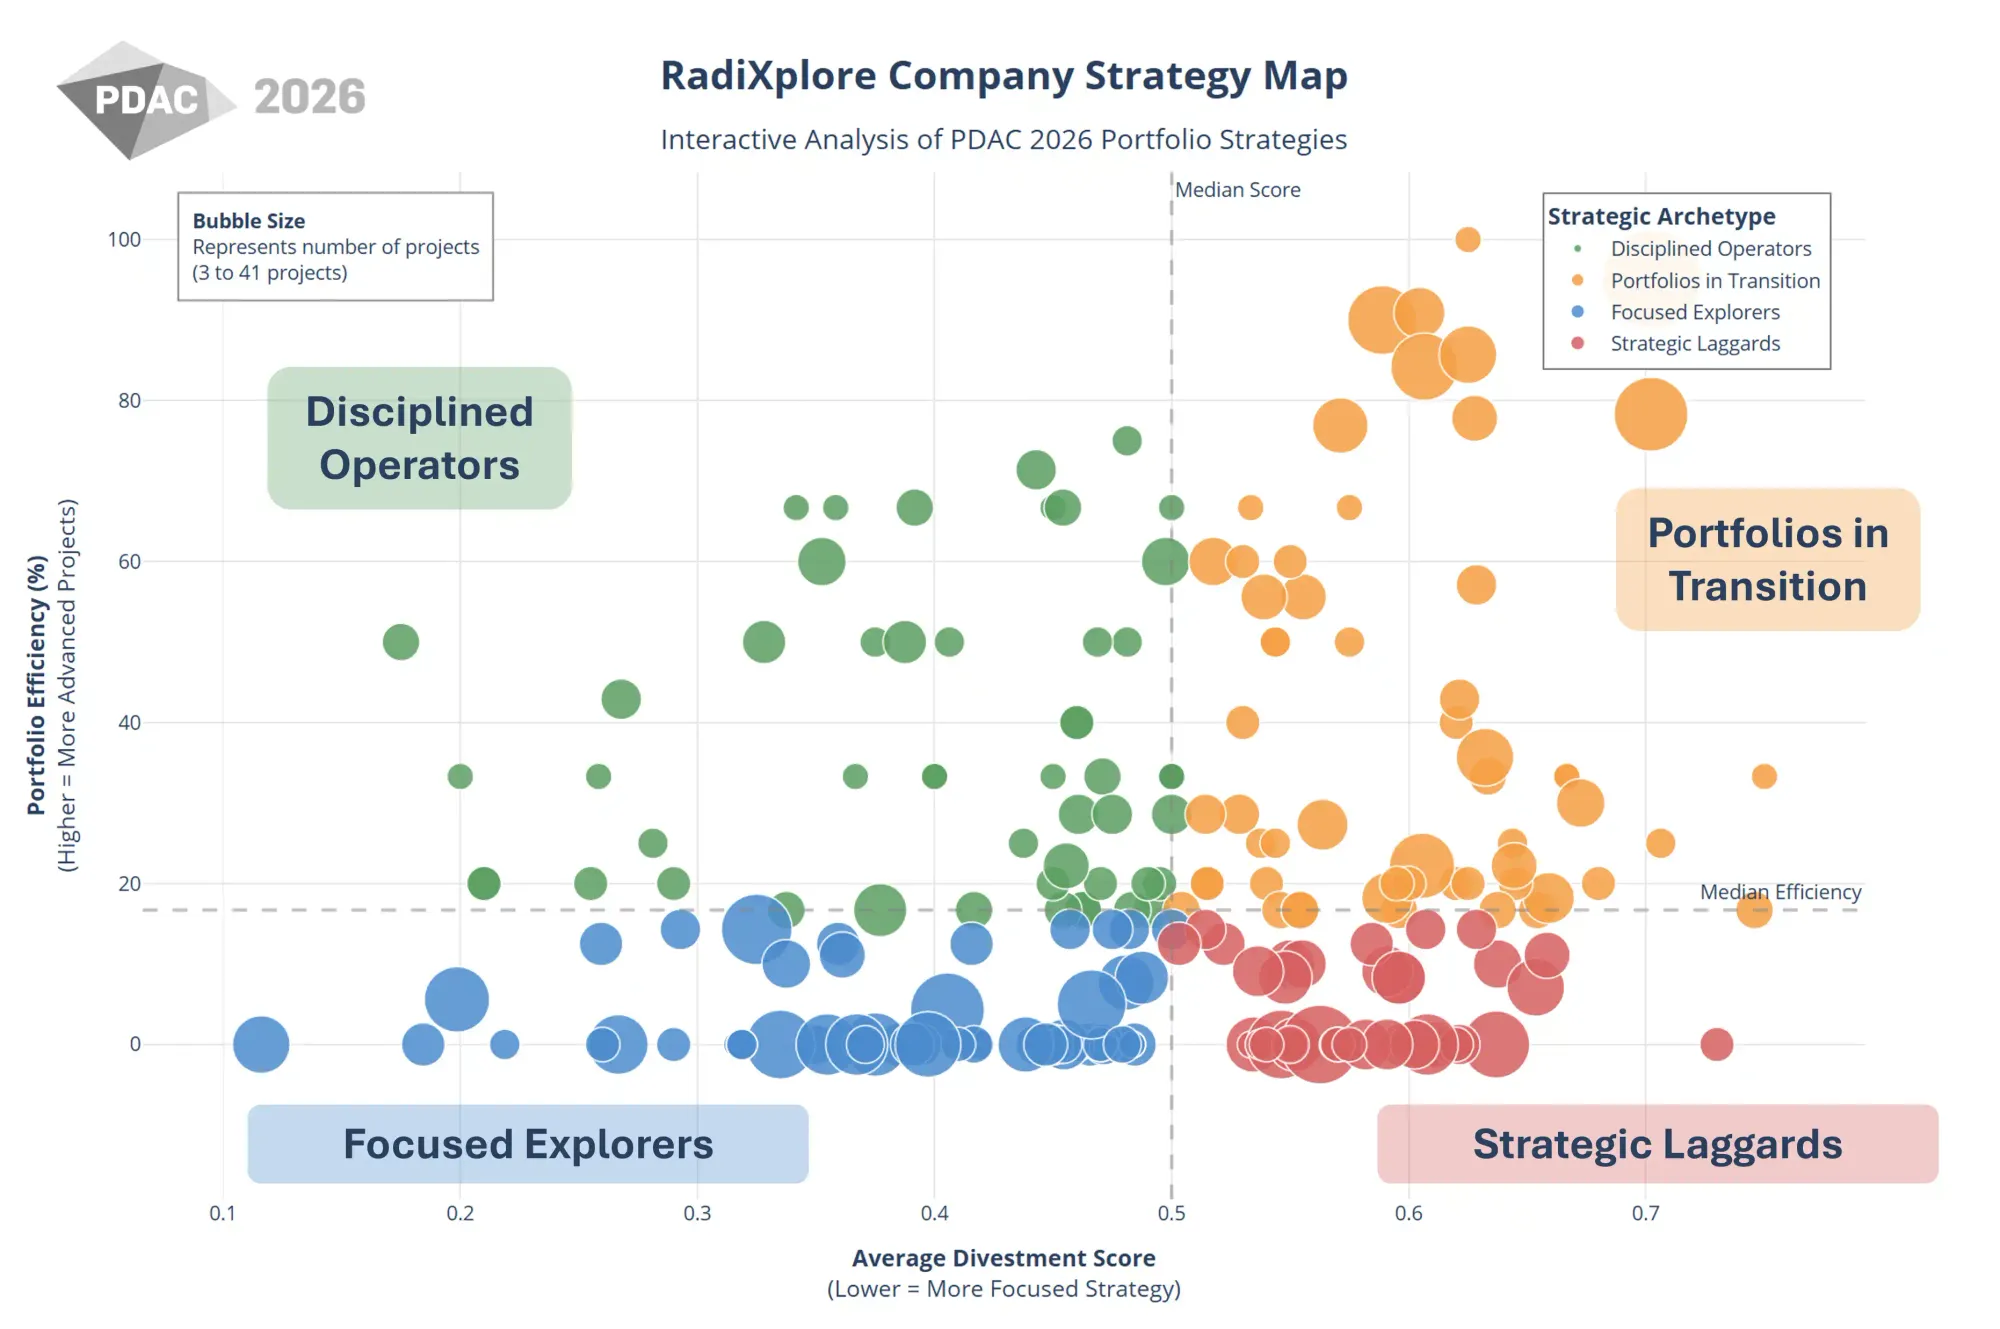
Bubble Analytics
- X-Axis: Year-over-Year Momentum
- Y-Axis: Current Market Buzz
- Size: Geological Substance (drilling and resource updates vs promotional noise)
- Border Color: Divestment Tier
- Black 'X': Confirmed historical divestments
Divestment pressure + infrastructure proximity = elevated transaction probability.
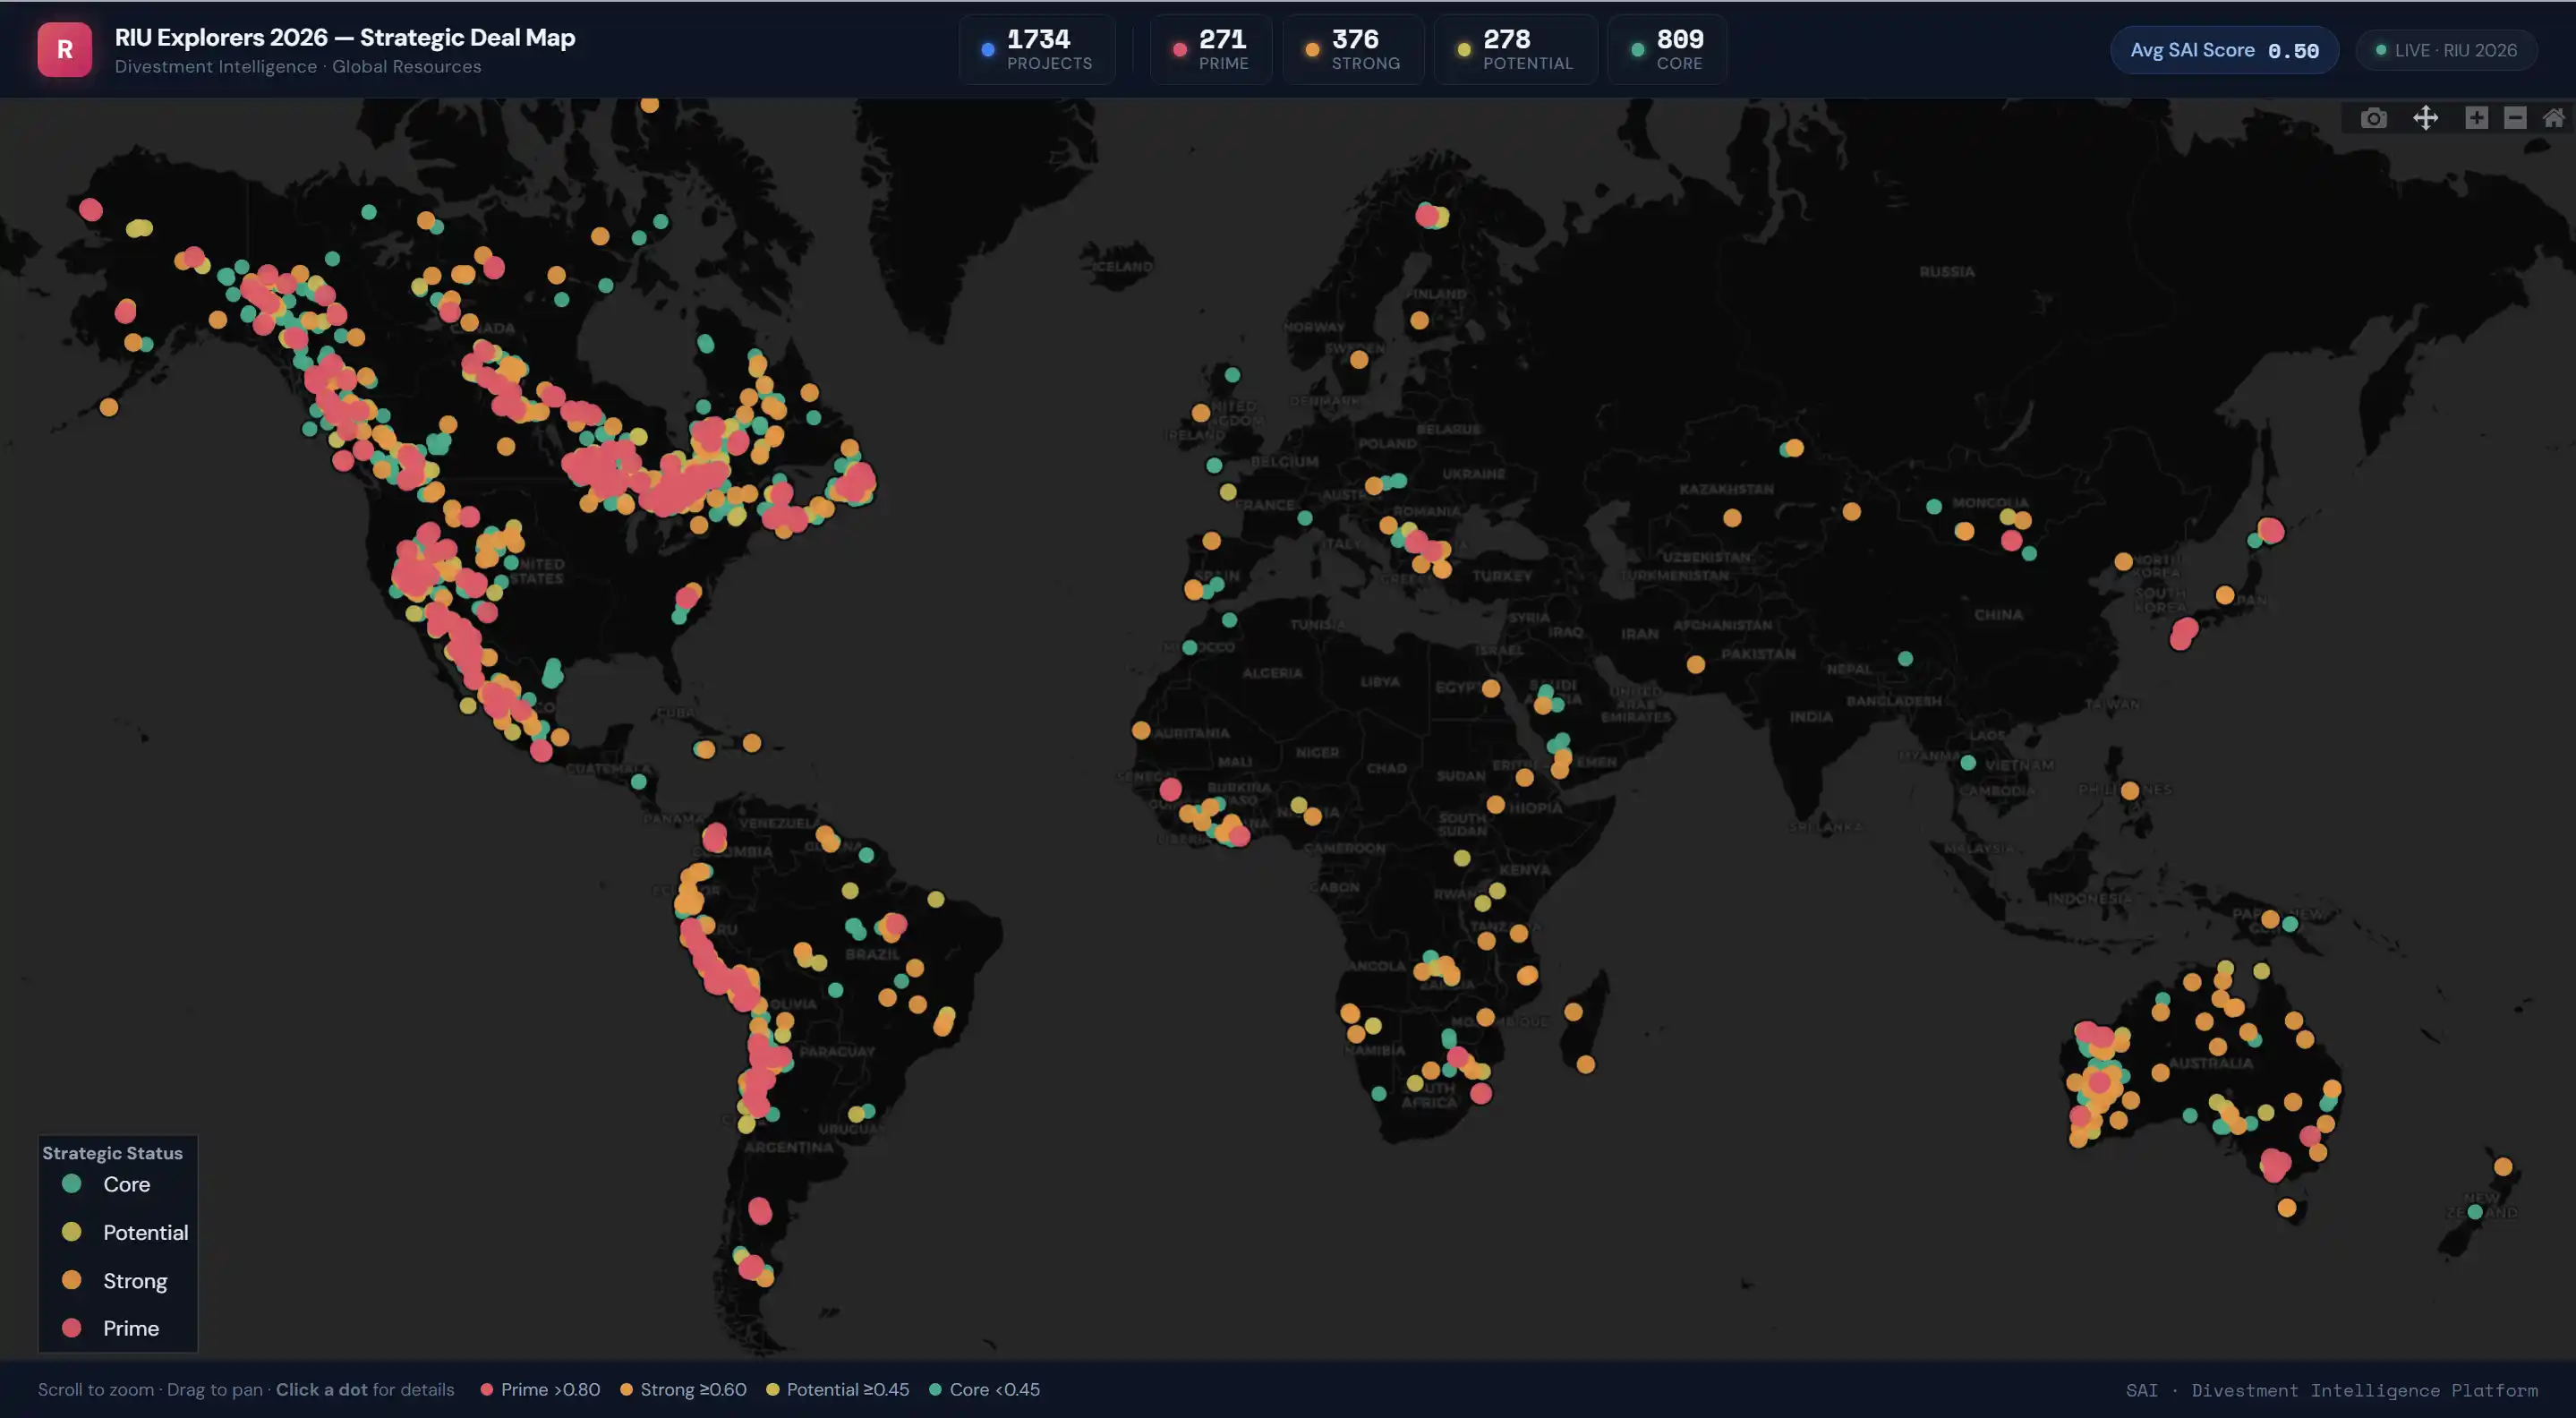
Interactive Mining M&A Database: The Strategic Opportunity Matrix
RadiXplore mapped all 1,734 PDAC 2026 projects into a live, interactive mining M&A intelligence layer. Click the image to Access the Strategic Deal Map. This is not a static visualization. It is a screening tool.
How to Use the Strategic Deal Map (2-Minute Guide)
1. Toggle Divestment Layers On / Off
On the left panel, click any divestment tier to turn it on or off:
- Core
- Potential
- Strong
- Prime
You can isolate only Prime assets, compare Strong vs Prime, or remove Core assets entirely.
Pro tip: Double-click a layer to view only that category.
2. Zoom by Jurisdiction
Scroll to zoom. Drag to pan.
This allows you to:
- Concentrate on a specific country
- Identify clustering around infrastructure hubs
- Assess geographic isolation at a glance
3. Click Any Project for Asset-Level Detail
Each node contains:
- Company
- Project name
- Divestment Score
- Strategic tier
- Structural drivers
This enables rapid portfolio-level screening before initiating outreach.
4. Use It as a Deal Filter — Not a Curiosity Tool
The highest transaction probability typically emerges where:
- Divestment Score is high
- Asset is geographically isolated
- Infrastructure proximity is visible
Divestment pressure + infrastructure adjacency = elevated M&A probability.
What This Map Actually Represents
The visualization aggregates:
- 1,734 global projects
- 271 Prime divestment candidates
- 376 Strong-tier JV / farm-in candidates
- Confirmed historical divestments for validation benchmarking
This is effectively a concentrated off-market M&A screening universe.
Mining M&A Trends Emerging from PDAC 2026
1. Major Producers: Capital Recycling at Scale
Large producers demonstrate high Portfolio Efficiency while maintaining identifiable non-core inventories.
This reflects disciplined capital recycling rather than portfolio weakness. Major producers remain the most consistent source of high-quality, sub-scale mining acquisition opportunities for mid-tier operators.
2. Africa & Middle East: Strategic Capital Reallocation
Countries with the highest average Divestment Scores include:
- Senegal (0.895)
- Ethiopia (0.750)
- Mauritania (0.750)
- Sudan (0.733)
These elevated scores reflect transitional capital dynamics:
Western juniors rationalizing frontier exposure while Gulf and sovereign-backed capital increases strategic allocation into African mining supply chains.
This is not capital flight. It is capital rotation.
3. The Bolt-On Acquisition Framework
RadiXplore calculates a Synergy Score measuring proximity to competitor infrastructure.
When:
- Divestment Score is high
- Synergy Score is high
Transaction probability increases materially.
Screening Prime divestment assets within 20km of existing mills represents one of the most capital-efficient mining M&A strategies in 2026.
4. Farm-In Opportunities in the "Strong" Tier
The dataset includes:
- 271 Prime projects (outright sale probability)
- 376 Strong projects (0.60-0.79 score range)
Strong-tier projects often represent non-core commodities within core jurisdictions.
These are high-probability joint venture or earn-in candidates rather than outright divestments.
The Strong tier is the mining industry's quiet farm-in frontier.
5. The Battery Metals Rationalization Cycle
Average Divestment Scores by commodity reveal post-cycle normalization:
- Precious Metals: 0.491
- Lithium: 0.511
- Battery & Tech Metals: 0.494
The elevated lithium and battery metals scores reflect consolidation following opportunistic acquisition cycles.
As capital tightens, non-core energy transition assets are migrating toward specialized operators.
High-Conviction Mining Acquisition Targets at PDAC 2026
Based on structural scoring and synergy overlays, several projects rank as high-conviction off-market candidates.
Xali Gold Corp. - Victoria Property (Canada)
Structural driver: 4,942 km geographic isolation from Mexico/Peru focus.
Implication: Capital likely to be redeployed toward Latin American development.
Volt Carbon Technologies - Redbird Moly-Copper Project (British Columbia)
Structural driver: Commodity and geographic mismatch following graphite pivot.
Implication: Portfolio simplification candidate.
Tartisan Nickel Corp. - Ichuña Copper-Silver Project (Peru)
Structural driver: Capital concentration in Ontario; Peru asset proximate to competitor infrastructure (9.3 km).
Implication: High-synergy bolt-on opportunity.
Access the Full Mining M&A Dataset
The public summary represents a subset of the Strategic Asset Index.
RadiXplore provides:
- Full access to all 647 Prime and Strong mining divestment and JV targets
- Confidential mining portfolio benchmarking
- Bespoke Strategic Portfolio Briefings for corporate development teams
Mining M&A advantage accrues to those who quantify structural pressure before it becomes public.
Book a Strategic Portfolio Briefing
Request a private demonstration of the Strategic Opportunity Platform to identify off-market mining acquisition targets aligned with your jurisdictional and commodity strategy.
Email: contact@radixplore.com
Website: www.radixplore.com
Legal Disclaimer
This report is for informational purposes only and does not constitute investment, financial, legal, or tax advice. All analysis is derived from publicly available data believed to be reliable but not guaranteed. Mining investments involve risk. Readers should conduct independent due diligence before making investment decisions.