The Great Mining Reshuffling: What 643 Projects at Diggers & Dealers 2025 Reveal About the Industry's Strategic Future
At Diggers & Dealers 2025, 643 mining projects reveal a sector in transition. Gold still dominates, but battery metals are rising fast—exposing deep strategic misalignments and major opportunities for M&A, divestments, and exploration focus.


How data from Australia's premier mining conference exposes a sector at the crossroads of tradition and transformation
The red dirt of Kalgoorlie has witnessed countless mining booms and busts, but the conversations echoing through the corridors of Diggers & Dealers 2025 (August 4-6) carried a different tenor this year. As 99 mining companies showcased their 643 active projects to packed audiences of geologists, investors, and corporate strategists, the underlying data told a story that few in the room fully grasped: the global mining sector is undergoing its most significant strategic realignment in decades.
Our comprehensive analysis of every project presented at this year's conference reveals a industry caught between two worlds—clinging to the profitable certainties of precious metals while racing to capture the explosive growth of battery minerals. The numbers are staggering: 65.5% of all projects are strategically misaligned with their parent companies' core focus, suggesting an unprecedented wave of consolidation and portfolio rationalization is not just coming—it's overdue.
For exploration managers juggling resource allocation decisions, corporate finance teams evaluating M&A opportunities, and geologists trying to predict where the next big discoveries will emerge, this data provides a roadmap through the chaos. Here's what the numbers reveal about where the mining industry is heading, and more importantly, where the opportunities lie hidden.
Understanding the Strategic Flags: How We Decoded Portfolio Alignment
Before diving into the insights, it's crucial to understand how we identified strategic misalignment. Our analysis employed sophisticated algorithms to flag projects based on four key criteria:
Non-Core Commodity Flag: Projects whose commodity groups don't align with their parent company's strategic focus. We calculated each company's "core" by weighting all their projects by development stage priority (production projects weighted highest, exploration lowest), then summing these weights by commodity group. Any project whose commodity groups fall outside the company's highest-weighted commodity focus gets flagged.
Non-Core Geography Flag: Projects located outside a company's primary operational regions. Similar to commodities, we weight each geographic location by project maturity, then flag projects in regions that don't align with the company's geographic center of gravity.
Geographic Isolation Score: The average distance (in kilometers) from each project to all other projects owned by the same company. Projects with isolation scores above 500km are flagged as potentially stranded assets facing higher operational costs.
Consolidated Non-Core Flag: Projects flagged for any combination of commodity misalignment, geographic misalignment, geographic isolation, or insufficient data quality.
This methodology reveals strategic coherence (or lack thereof) that isn't visible in traditional company presentations, providing unprecedented insight into portfolio optimization opportunities.
The Precious Metals Powerhouse: 568 Projects Prove Gold Still Rules
While everyone talks about battery metals, precious metals quietly dominate with 568 projects—nearly 43% of all activity at Diggers & Dealers 2025.
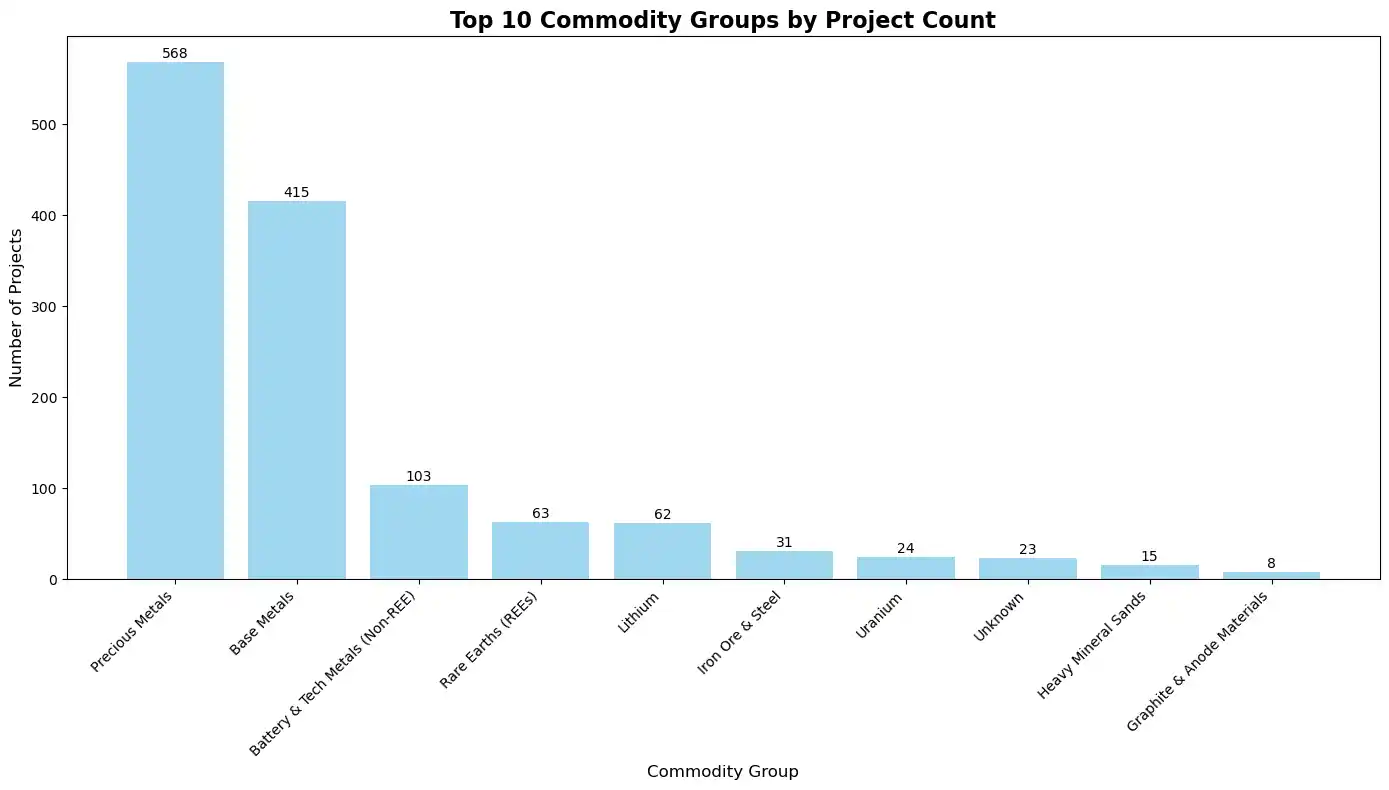
Before diving into the energy transition narrative, let's address the elephant in the room: precious metals remain the backbone of the mining sector. With 568 projects, precious metals dwarf every other commodity group, including the much-hyped battery metals sector (252 projects). This dominance isn't just about legacy assets—it reflects ongoing robust investment in gold, silver, and platinum group metals.
The Precious Metals Strategic Landscape
The precious metals distribution reveals a sector that's anything but stagnant:
- 343 precious metals projects flagged as potential divestment candidates in our non-core analysis
- Strong representation across all development stages, from exploration through production
- Geographic concentration primarily in Australia's proven gold provinces
Key Strategic Insight: While media attention focuses on battery metals, the precious metals sector's scale means small efficiency improvements here can generate massive value. Companies like KALGOORLIE GOLD MINING LIMITED and RAMELIUS RESOURCES LIMITED demonstrate how strategic focus in precious metals can deliver exceptional portfolio efficiency.
The Gold vs. Battery Metals Tension
What's particularly interesting is how companies are balancing traditional precious metals strength with energy transition opportunities. Our analysis reveals that many companies with strong precious metals cores are adding battery metals projects—but often these end up flagged as non-core, suggesting potential strategic conflicts.
Strategic Question for Portfolio Managers: Should precious metals companies stick to what they know best, or is diversification into battery metals essential for future relevance?
The Battery Metals Gold Rush: 252 Projects Chasing the Energy Transition
Is your company positioning for the $1 trillion energy storage market, or still betting on yesterday's commodities?
While precious metals dominate by sheer numbers, the 252 battery metals projects represent the sector's most dynamic growth area. This 39.2% of all exploration and development activity signals where the smart money sees future value creation.
The Battery Metals Breakdown: Where the Smart Money is Going
The distribution tells a compelling story:
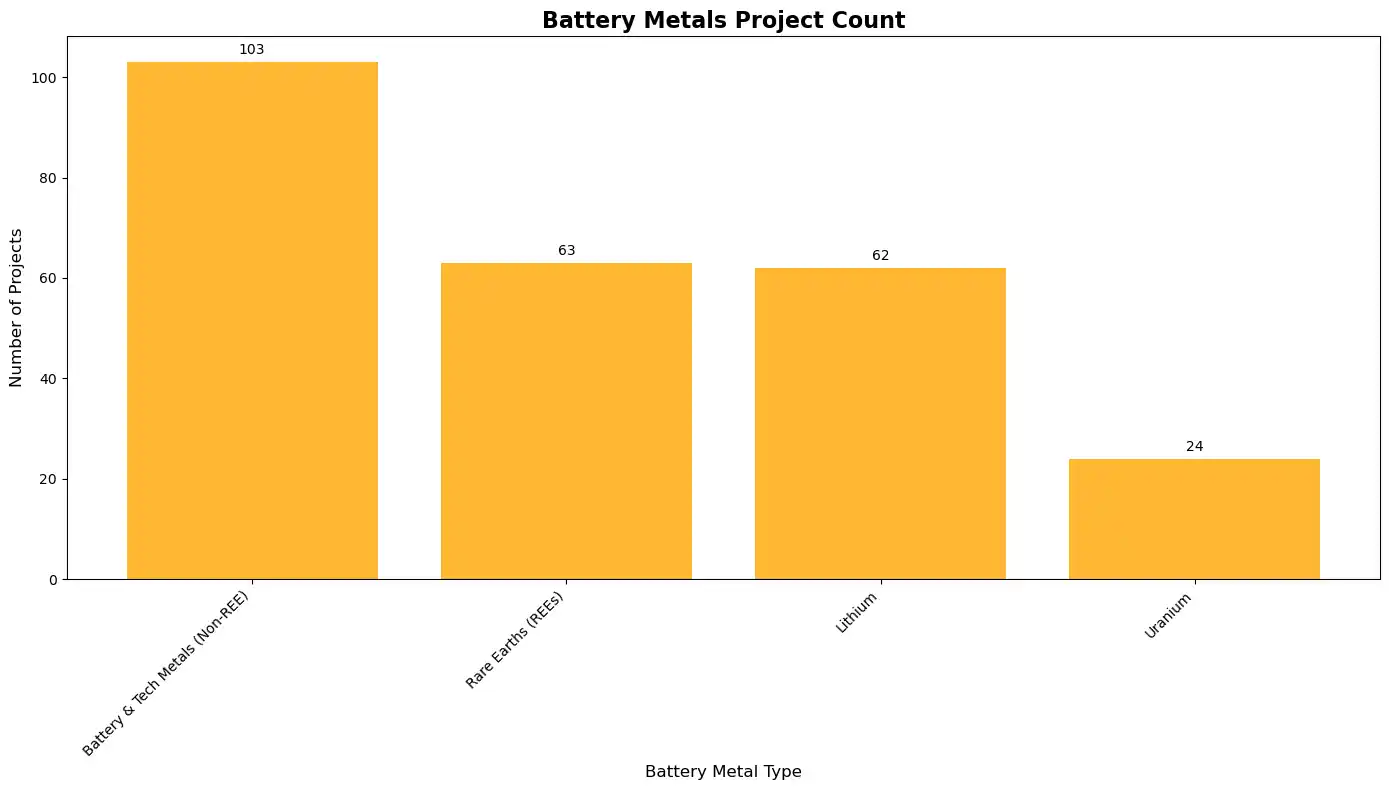
- Battery & Tech Metals (Non-REE): 103 projects leading the charge
- Rare Earth Elements (REEs): 63 projects, with LYNAS commanding 26 of these
- Lithium: 62 projects concentrated heavily in Western Australia
- Uranium: 24 projects as nuclear power gains renewed acceptance
But here's the concerning reality check: 74% of these battery metals projects remain trapped in exploration phases. While companies are clearly pivoting toward energy transition minerals, the industry faces a critical "development gap" that could determine which players emerge as long-term winners.
Geographic Hotspots: The New Lithium Provinces
Our analysis reveals lithium project clustering patterns that should inform your next exploration strategy:
Western Australia's Dominance: 47 of 62 global lithium projects are concentrated here, with emerging hotspots around:
- Southern Cross region (2 major projects)
- West Pilbara Region (2 projects)
- Areas adjacent to proven producers like Mt Cattlin
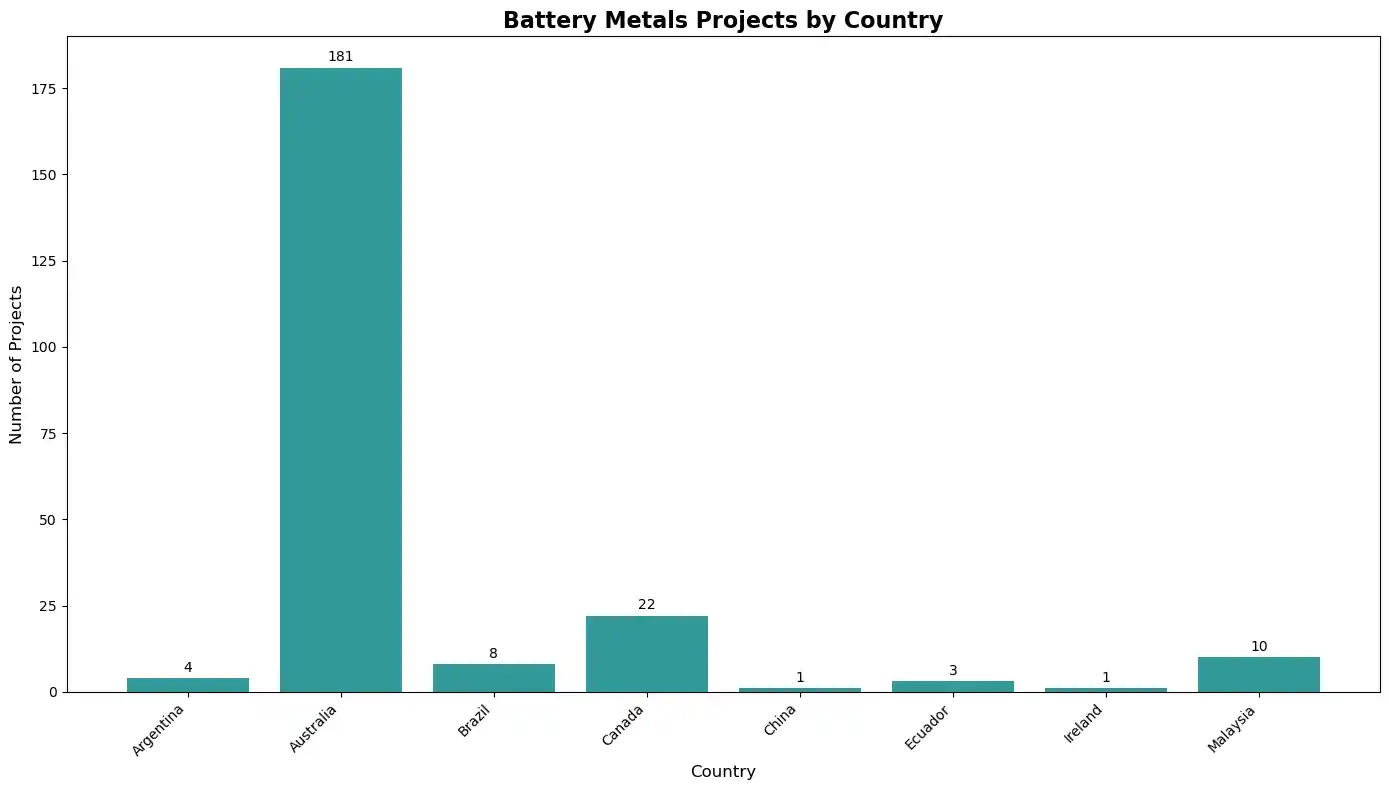
Argentina's Strategic Positioning: While only 4 projects, they're concentrated in the proven Lithium Triangle, including 2 projects at Pocitos Salar—a location that savvy exploration teams should be watching closely.
Strategic Insight for Exploration Managers: The data suggests that proximity to existing infrastructure and proven geology trumps frontier exploration in lithium. Companies with projects within 30km of established operations are showing higher advancement rates through development phases.
Australia's Mining Hegemony: 479 Projects and the Concentration Risk Nobody's Talking About
When 74.5% of global mining investment flows into a single continent, what does that mean for supply chain resilience?
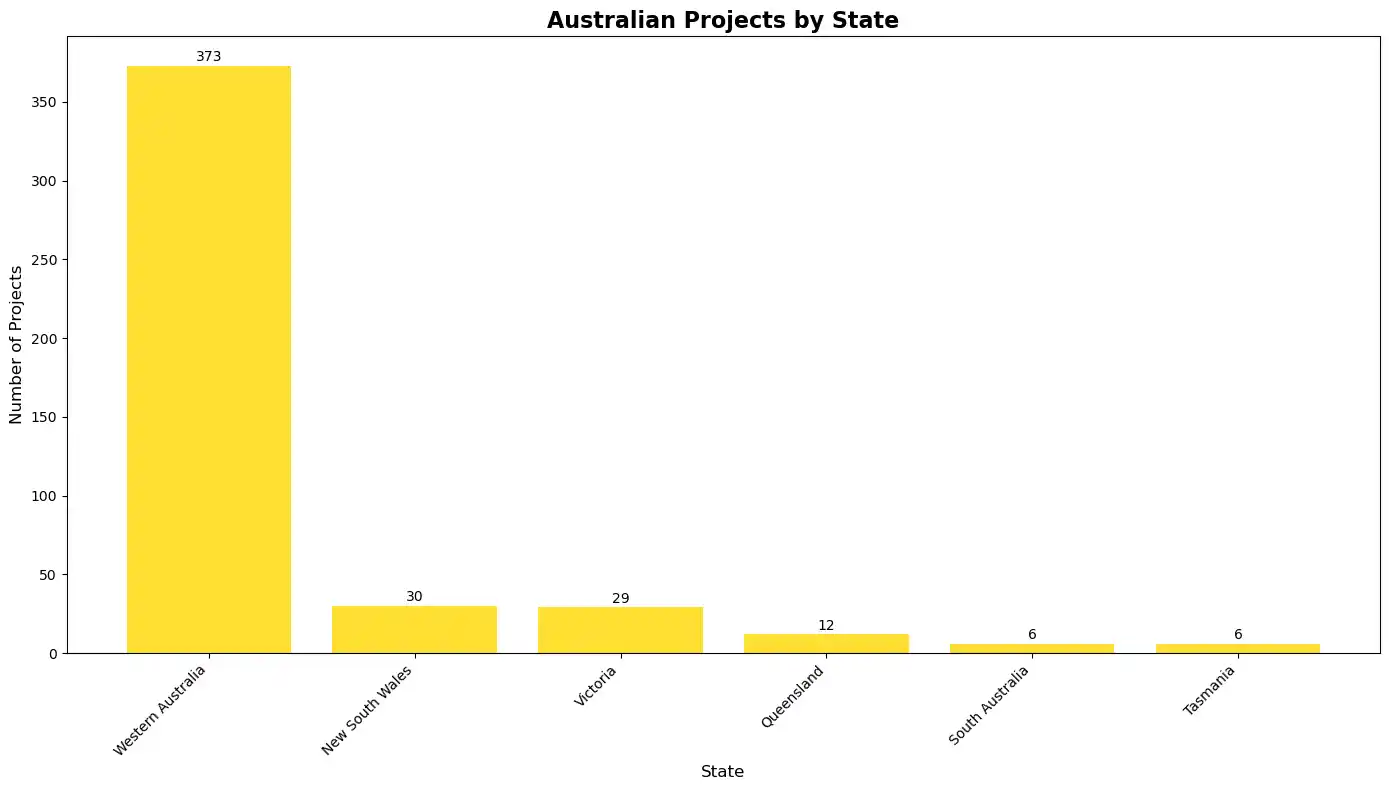
The geographic concentration revealed in our analysis is both Australia's greatest strength and its most significant vulnerability. With 479 of 643 projects located in Australia—and a staggering 373 concentrated in Western Australia alone—the global mining sector has essentially bet its future on a single jurisdiction.
The WA Phenomenon: Infrastructure Advantage or Dangerous Concentration?
Western Australia's magnetic pull for mining investment creates a fascinating strategic paradox:
The Infrastructure Advantage:
- Established rail and port networks
- Proven regulatory framework
- Deep pool of skilled mining professionals
- Proximity to Asian markets
The Concentration Risk:
- Labor shortage pressures already emerging
- Infrastructure bottlenecks at ports and rail
- Regulatory risk concentrated in single jurisdiction
- Climate change impacts on a single geographic region
Advanced Project Distribution: Where the Real Action Is
When we filter for advanced projects (feasibility, development, construction, and production phases), the geographic picture shifts slightly but remains heavily Australia-centric:
- Australia: 106 advanced projects
- Canada: 25 advanced projects
- Brazil: 4 advanced projects
Key Insight for Corporate Finance Teams: Companies with geographically diversified portfolios may be undervalued by markets focused on the Australian mining story. Our analysis identifies several companies with advanced projects in Brazil, Canada, and Africa that could offer portfolio diversification benefits.
The Strategic Focus Divide: Why 65.5% of Projects Don't Match Company Strategies
In a sector where capital efficiency determines survival, why are two-thirds of all projects strategically misaligned?
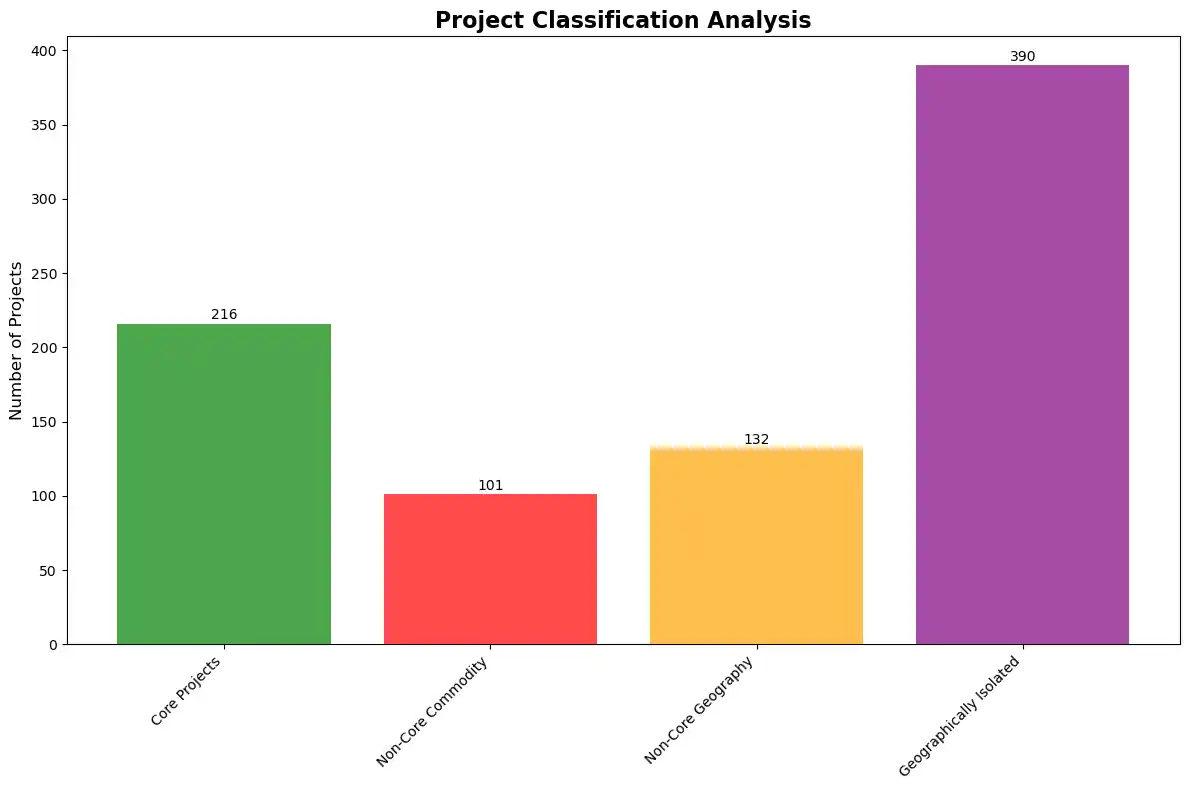
Perhaps the most startling finding from our analysis is that 421 of 643 projects are flagged as non-core to their parent companies' strategic focus. This represents a staggering misallocation of capital and management attention that creates unprecedented opportunities for those who recognize it.
Decoding Strategic Misalignment: The Methodology Behind the Numbers
Understanding how we identified these strategic mismatches is crucial for applying these insights:
Core Commodity Determination Process:
- Priority Weighting: Each project receives a "status priority" score based on development stage (Production = 5, Development = 4, Feasibility = 3, Exploration = 1)
- Commodity Scoring: For each company, we sum these priority weights across all commodity groups in their portfolio
- Core Identification: The commodity group(s) with the highest total weighted score become the company's "core focus"
- Non-Core Flagging: Any project whose commodity groups don't include at least one core commodity gets flagged
Example: If Company X has 8 gold exploration projects (8 × 1 = 8 points) and 2 gold production projects (2 × 5 = 10 points), gold scores 18 points. If they also have 3 lithium exploration projects (3 × 1 = 3 points), any lithium project would be flagged as non-core since gold (18) significantly outweighs lithium (3).
Geographic Core Calculation: The same weighting methodology applies to geography, using country-state combinations. Projects outside a company's highest-weighted geographic regions get flagged as non-core geography.
Geographic Isolation Scoring: For each project, we calculate the geodesic distance to every other project owned by the same company, then average these distances. Projects with average distances above 500km are flagged as geographically isolated—indicating potential operational inefficiencies and higher costs.
Why This Matters: This algorithmic approach reveals strategic incoherence that traditional analysis misses. A company might claim "diversification" while our data shows they're actually spreading resources across unrelated assets that don't create operational synergies.
The Strategic Focus Champions: Companies Getting It Right
A small group of companies demonstrate what strategic coherence looks like:
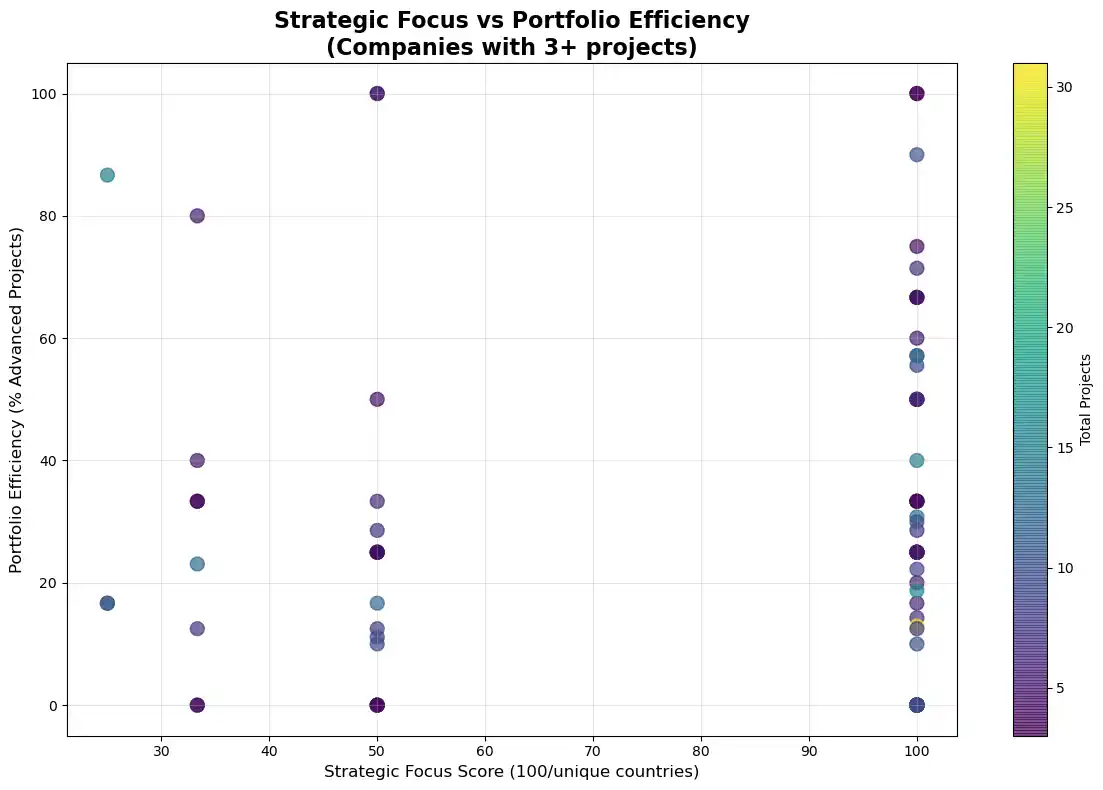
Perfect Strategic Focus (100% score):
- RAMELIUS RESOURCES LIMITED: 10 precious metals projects, 90% portfolio efficiency
- K92 Mining Inc.: 2 precious metals projects, both advanced-stage
- KALGOORLIE GOLD MINING LIMITED: 9 projects, pure gold focus—the poster child for precious metals specialization
- ORA BANDA MINING LTD: 16 precious metals projects in concentrated geographic area
The Precious Metals Advantage: Notice how many of the highest-performing companies are precious metals focused? This suggests that while battery metals grab headlines, operational excellence in gold and silver projects delivers more consistent returns.
These companies share common traits: geographic clustering, commodity specialization, and higher ratios of advanced-to-exploration projects. Notably, precious metals companies appear to be more successful at advancing projects through development phases compared to battery metals companies.
The Scattered Portfolio Problem: Acquisition Opportunities Hiding in Plain Sight
At the opposite extreme, several companies present with concerning strategic fragmentation:
High Non-Core Exposure (50%+ of projects misaligned):
- RED HILL MINERALS LIMITED: 66.7% non-core across 6 projects
- MAGNETIC RESOURCES NL: 54.8% non-core across 31 projects
- CAZALY RESOURCES LIMITED: 53.8% non-core across 13 projects
Strategic Insight for M&A Teams: These companies represent prime acquisition or spin-off opportunities. Their non-core assets could be core growth assets for buyers with different strategic focuses.
The Geographic Isolation Challenge: Stranded Assets in Plain Sight
Our isolation analysis reveals projects that may be operationally stranded:
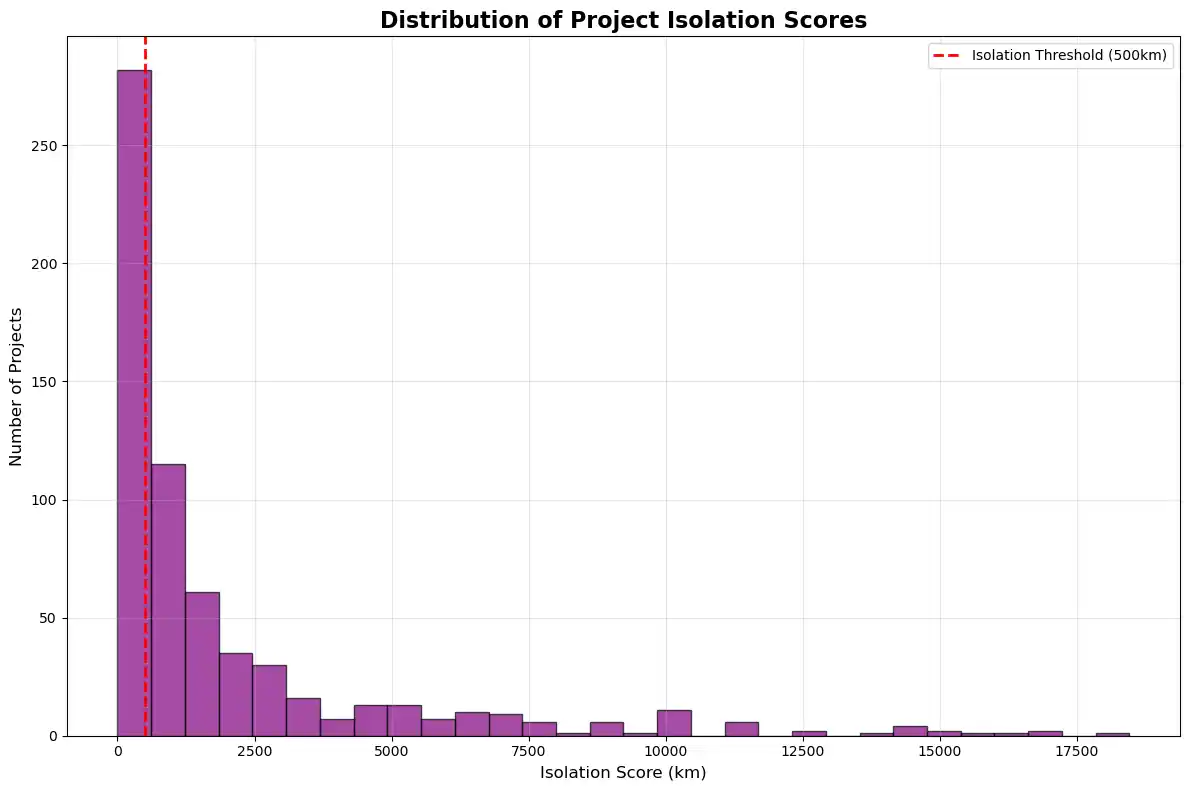
Most Geographically Isolated Projects:
- Nueva Esperanza Development Project (Chile): 18,455 km average distance from KINGSGATE's other projects
- Limestone Well Vanadium-Titanium Project (WA): 17,113 km average distance from FIREFLY METALS' other assets
- Louisiana Production Facility: 16,975 km from ELEMENT 25's core Australian operations
The Isolation Score Reality Check: These astronomical distances aren't just numbers—they represent real operational challenges:
- Management attention divided across multiple time zones and jurisdictions
- Technical expertise and equipment sharing nearly impossible
- Corporate overhead multiplied across disconnected locations
- Financing complexity as lenders evaluate scattered asset portfolios
Strategic Interpretation: Projects with isolation scores above 10,000 km face significant operational challenges and may be prime divestment candidates. Companies with multiple high-isolation projects often trade at valuation discounts due to perceived management complexity.
Methodology Note: We calculate isolation scores using great circle distances between project centroids. While a project might be "only" 1,000 km from another company asset, if it's the only project in that region, it still faces isolation challenges that clustered portfolios avoid.
Portfolio Quality Crisis: The Great Exploration Bottleneck of 2025
Why are 68.6% of mining projects stuck in exploration phase, and what does this mean for future supply?
The project status distribution from Diggers & Dealers reveals a concerning pattern that should worry supply chain strategists and delight investors who can identify companies breaking through the bottleneck.
The Development Pipeline Reality
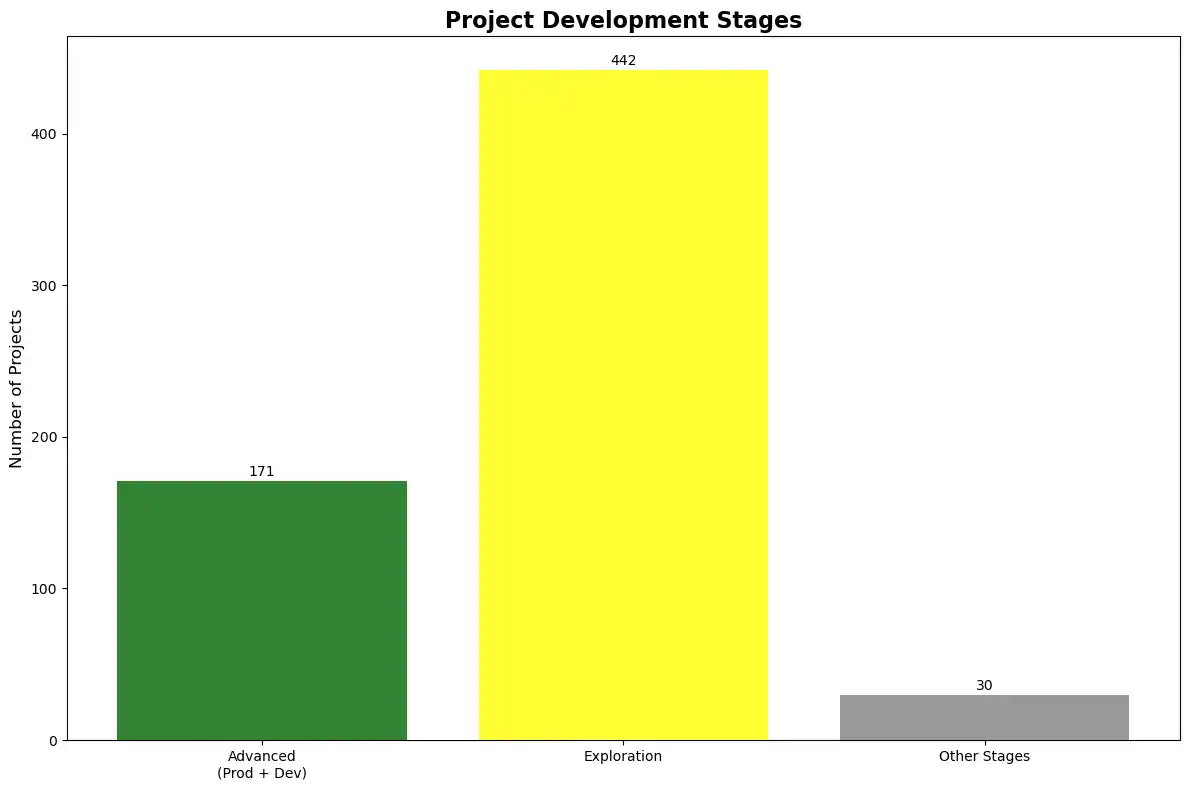
Current Project Status Breakdown:
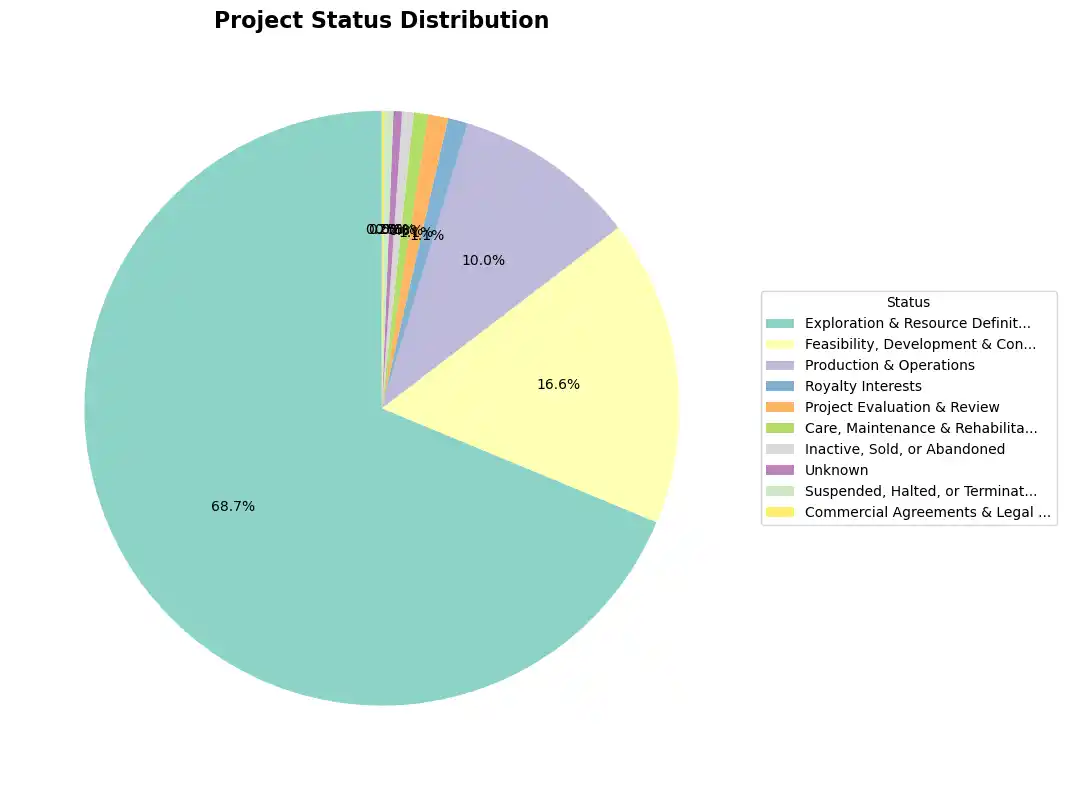
- Exploration & Resource Definition: 442 projects (68.6%)
- Feasibility, Development & Construction: 107 projects (16.6%)
- Production & Operations: 64 projects (9.9%)
- All Other Stages: 30 projects (4.9%)
This distribution suggests either:
- Capital constraints preventing project advancement
- Geological challenges proving more difficult than anticipated
- Strategic focus on land banking rather than development
- Market timing as companies wait for better commodity prices
Portfolio Efficiency Leaders: The 100% Club
A select group of companies demonstrate exceptional ability to advance projects through development phases:
Perfect Portfolio Efficiency (100% advanced projects):
- EVOLUTION MINING LIMITED: All 6 projects in advanced stages
- EMERALD RESOURCES NL: All 3 projects advanced
- SouthGobi Resources Ltd.: All 3 projects advanced
- WEST AFRICAN RESOURCES LIMITED: All 3 projects advanced
Strategic Insight for Exploration Managers: These companies have cracked the code on project advancement. Study their approaches to permitting, financing, and technical development—they're clearly doing something different.
The M&A Opportunity Map: $10 Billion+ in Misallocated Assets
With 421 non-core projects in play, where are the best consolidation opportunities hiding?
Our non-core project analysis reveals the largest portfolio rationalization opportunity in mining sector history. The strategic misalignment isn't just academic—it represents billions of dollars in assets that could create significantly more value under different ownership.
Prime Acquisition Targets: Companies with 100% Non-Core Exposure
Several companies present with their entire portfolios potentially available:
Complete Portfolio Candidates:
- A.I.S. Resources Limited: 8 projects, 100% non-core (spread across lithium, precious metals, and battery metals with no clear strategic focus)
- KALAMAZOO RESOURCES LIMITED: 7 projects, 100% non-core (multiple precious metals projects that don't achieve critical mass in any geography)
- PALADIN ENERGY LTD: 6 uranium projects, 100% non-core (uranium projects scattered globally, flagged due to geographic dispersion)
- LYNAS RARE EARTHS LIMITED: 5 projects, surprisingly 100% non-core (despite REE market leadership, their geographic spread across Australia, Malaysia, and USA creates non-core flags)
Understanding the LYNAS Anomaly: LYNAS's appearance on this list demonstrates the power of our algorithmic approach. While they're clearly the global leader in rare earth processing, their projects span three countries and multiple stages of the value chain. Our algorithm flags this as strategic dispersion, though market participants would likely view it as vertical integration. This highlights how different analytical frameworks can reveal different strategic insights.
Commodity-Specific Consolidation Plays
Precious Metals Rationalization: With 343 precious metals projects flagged as non-core, there's enormous opportunity for gold and silver specialists to acquire scattered assets from diversified companies. This represents the largest single consolidation opportunity in the sector.
Battery Metals Consolidation: 171 non-core battery metals projects create opportunities for:
- Lithium specialists to acquire scattered lithium projects
- REE players to build integrated supply chains
- Tech metals focused companies to create commodity clusters
The Precious Metals vs. Battery Metals Dynamic: Interestingly, companies trying to bridge both sectors often end up with high non-core percentages. This suggests the market may reward pure-play strategies over diversification.
Geographic Consolidation: Projects scattered across multiple jurisdictions within single companies create opportunities for region-focused buyers to build operational clusters.
The Divestment Wave: What's Coming to Market
Based on our analysis, expect significant asset sales in these categories:
- Geographically isolated projects (500+ km from other company assets)
- Single-asset commodity exposures for companies focused elsewhere
- Early-stage exploration projects as companies focus capital on advanced assets
- Cross-border assets as companies simplify jurisdictional exposure
What the Data Reveals: Five Key Patterns from Diggers & Dealers 2025
The numbers from the conference reveal distinct patterns that industry professionals can evaluate against their own strategic context.
1. The Battery Metals Development Gap
The data shows that 74% of battery metals projects remain in exploration phases, compared to more advanced development rates in precious metals projects. This pattern suggests different risk-reward profiles across commodity types, though the reasons behind this pattern would require additional industry context to fully understand.
2. Geographic Concentration Patterns
Western Australia's dominance (58% of all projects globally) creates an interesting risk-return dynamic. Companies with geographically diversified portfolios show different risk profiles than those concentrated in single jurisdictions, though whether this represents advantage or disadvantage depends on individual company circumstances and market conditions.
3. Strategic Focus Correlation with Portfolio Efficiency
Companies with lower non-core percentages tend to show higher ratios of advanced-to-exploration projects. This correlation appears consistent across commodity types, though causation could run in either direction or be influenced by other factors not captured in this dataset.
4. The Scale of Portfolio Misalignment
With 65.5% of projects flagged as potentially misaligned with company strategies, the data suggests significant opportunities exist for portfolio optimization. However, what constitutes "optimal" depends heavily on individual company strategies, market conditions, and operational capabilities.
5. Infrastructure and Clustering Effects
Projects within 50km of existing operations show different advancement patterns through development phases compared to isolated projects. This pattern is consistent with infrastructure economics, though other factors may also contribute to these differences.
Key Findings: What the Diggers & Dealers 2025 Data Reveals
The analysis of 643 mining projects from this year's conference reveals several notable patterns that industry professionals can evaluate within their own strategic context:
Portfolio Alignment Patterns: The data shows 65.5% of projects flagged as potentially misaligned with their parent companies' strategic focus, indicating significant variation in how companies structure their portfolios across commodities and geographies.
Commodity Distribution Dynamics: While precious metals dominate with 568 projects (42.7%), battery metals represent 252 projects (39.2%) despite being a newer focus area. The development stage distribution differs notably between these sectors.
Geographic Concentration Effects: The heavy concentration in Western Australia (58% of global projects) creates interesting comparative data points for companies with different geographic strategies.
Development Pipeline Characteristics: Project advancement rates through development phases show correlations with strategic focus metrics, geographic clustering, and commodity types, though multiple factors likely contribute to these patterns.
Data-Driven Observations vs. Strategic Advice: This analysis presents what the numbers reveal rather than prescriptive recommendations. Individual companies will need to evaluate these patterns against their own capabilities, market positions, and strategic objectives to determine relevance to their specific situations.
Continuing the Analysis: The patterns revealed in this data raise important questions about portfolio optimization, strategic focus, and market dynamics that industry professionals can explore further within their own organizational contexts. Each company's optimal approach will depend on factors beyond what any single dataset can capture.
About This Analysis: Powered by RadiXplore's Intelligence Engine
This comprehensive analysis of 643 mining projects from Diggers & Dealers 2025 demonstrates the power of systematic data intelligence in revealing industry patterns that aren't visible through traditional methods. At RadiXplore, we specialize in synthesizing complex mining data—from corporate ownership and financial health to historical exploration records and modern geological datasets—into actionable intelligence.
For Mining Companies: Whether you're evaluating M&A opportunities, optimizing your portfolio, or identifying strategic gaps in your commodity exposure, our platform reveals the connections and patterns that drive better decision-making. The strategic misalignment patterns highlighted in this analysis represent exactly the type of intelligence our clients use to identify undervalued acquisition targets or optimize their own portfolios.
For Investors & Corporate Finance Teams: Our corporate intelligence capabilities help you quickly assess which companies have coherent strategies versus scattered portfolios, understand geographic concentration risks, and identify potential consolidation plays before they become obvious to the broader market.
For Government & Industry Analysts: This type of systematic analysis across entire industry segments helps inform policy decisions, understand supply chain risks, and track the progress of critical mineral development initiatives.
Ready to dig deeper into the data behind your next strategic decision? Contact us at radixplore.com to learn how our AI-powered intelligence platform can provide similar insights tailored to your specific needs and datasets.
This analysis is based on comprehensive data from 643 mining projects presented by 99 companies at Diggers & Dealers 2025. The findings represent data patterns rather than investment or strategic advice. Professional evaluation of these patterns should consider additional factors specific to individual company circumstances and market conditions.