Unlocking Hidden Value at RIU Explorers 2026: Data-Driven M&A and Portfolio Strategy
Data analysis of 353 RIU Explorers 2026 projects reveals hidden M&A targets, non-core assets, and capital-efficiency opportunities across Australia. See how RadiXplore’s Strategic Asset Index identifies divestments, consolidation trends, and portfolio optimisation signals.

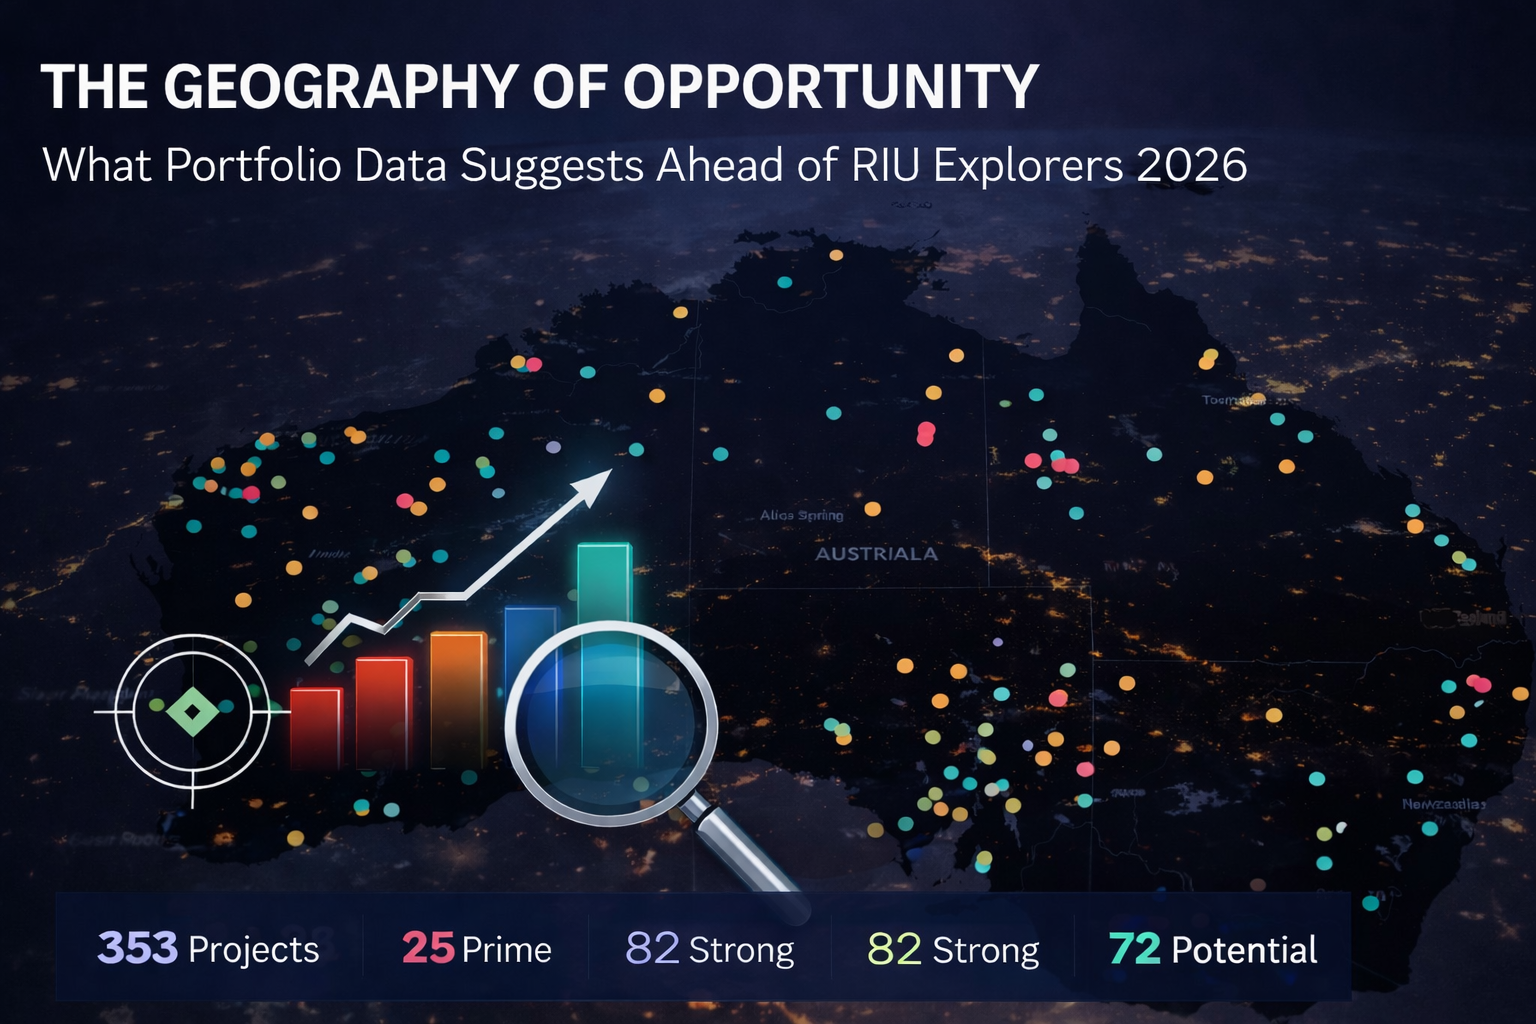
As the mining industry gathers in Fremantle for the RIU Explorers Conference, the prevailing narratives are rightly focused on discovery and the record-breaking gold price. However, beneath the polished presentations and drilling highlights, the data reveals a secondary, equally powerful story: a significant opportunity for capital efficiency and strategic rationalisation.
Relying on corporate narratives alone often means missing the structural opportunities that drive M&A. To uncover these hidden value drivers, we analysed the 353-project portfolio of the exhibiting companies using RadiXplore's dual-lens intelligence framework.
Our goal? To identify which assets are "Crown Jewels"-driving the company's future-and which are high-quality "Hidden Gems" that might be unlocked to fund that future.
The Methodology: A Proven Predictive Model
We measure every project through two distinct lenses:
- Market Momentum: To differentiate between genuine geological news (drilling, resources) and corporate noise.
- Strategic Fit (SAI Score): Scoring assets on their commodity and geographic alignment with the owner's core business.
Does it work?
In a real-world backtest on this specific dataset, our Strategic Asset Index (SAI) correctly identified 42% of actual historical divestments ahead of time. This includes the recent A$86.1M sale of the Pickle Crow Gold Project by FireFly Metals-a transaction our model flagged as a high-probability event due to the asset's location relative to FireFly's core focus.
Key Findings from the 2026 RIU Explorers Cohort
The data paints a picture of a sector in transition, with three clear themes emerging:
1. The "Queensland Opportunity"
The most distinct trend in the data is a cluster of high-potential copper and gold assets in Northwest Queensland held by companies headquartered in Western Australia or South Australia. Projects like Antares Metals' Mt Isa North and Coda Minerals' Cameron River are high-quality assets, but they are geographically distinct from their owners' core operations.
- The Opportunity: For the current owners, these represent valuable assets that could be monetized to provide non-dilutive funding for their WA flagships. For Queensland-focused aggregators, this is a prime target list for regional consolidation.
2. The East Coast Disconnect
We observe a similar dynamic in New South Wales, where WA-centric explorers hold significant assets that fall outside their primary operational hubs. In one specific instance involving a Joint Venture, our model flagged a high-grade gold project as "Non-Core" for both partners. This suggests that a spin-out or sale could be the most effective way to unlock that project's full potential, ensuring it gets the management bandwidth it deserves.
3. Strategic Re-Focusing in a High-Gold Environment
With gold prices near historical highs, companies are rationally doubling down on their core precious metal assets. Our data shows elevated "divestment scores" for battery metal projects (Nickel, Lithium, Graphite) held by gold-focused teams. These assets aren't "distressed"-they are often advanced, resource-stage projects. However, they are competing for capital against high-margin gold exploration. This creates a unique window for battery-metal specialists to acquire advanced assets from gold majors looking to streamline their focus.
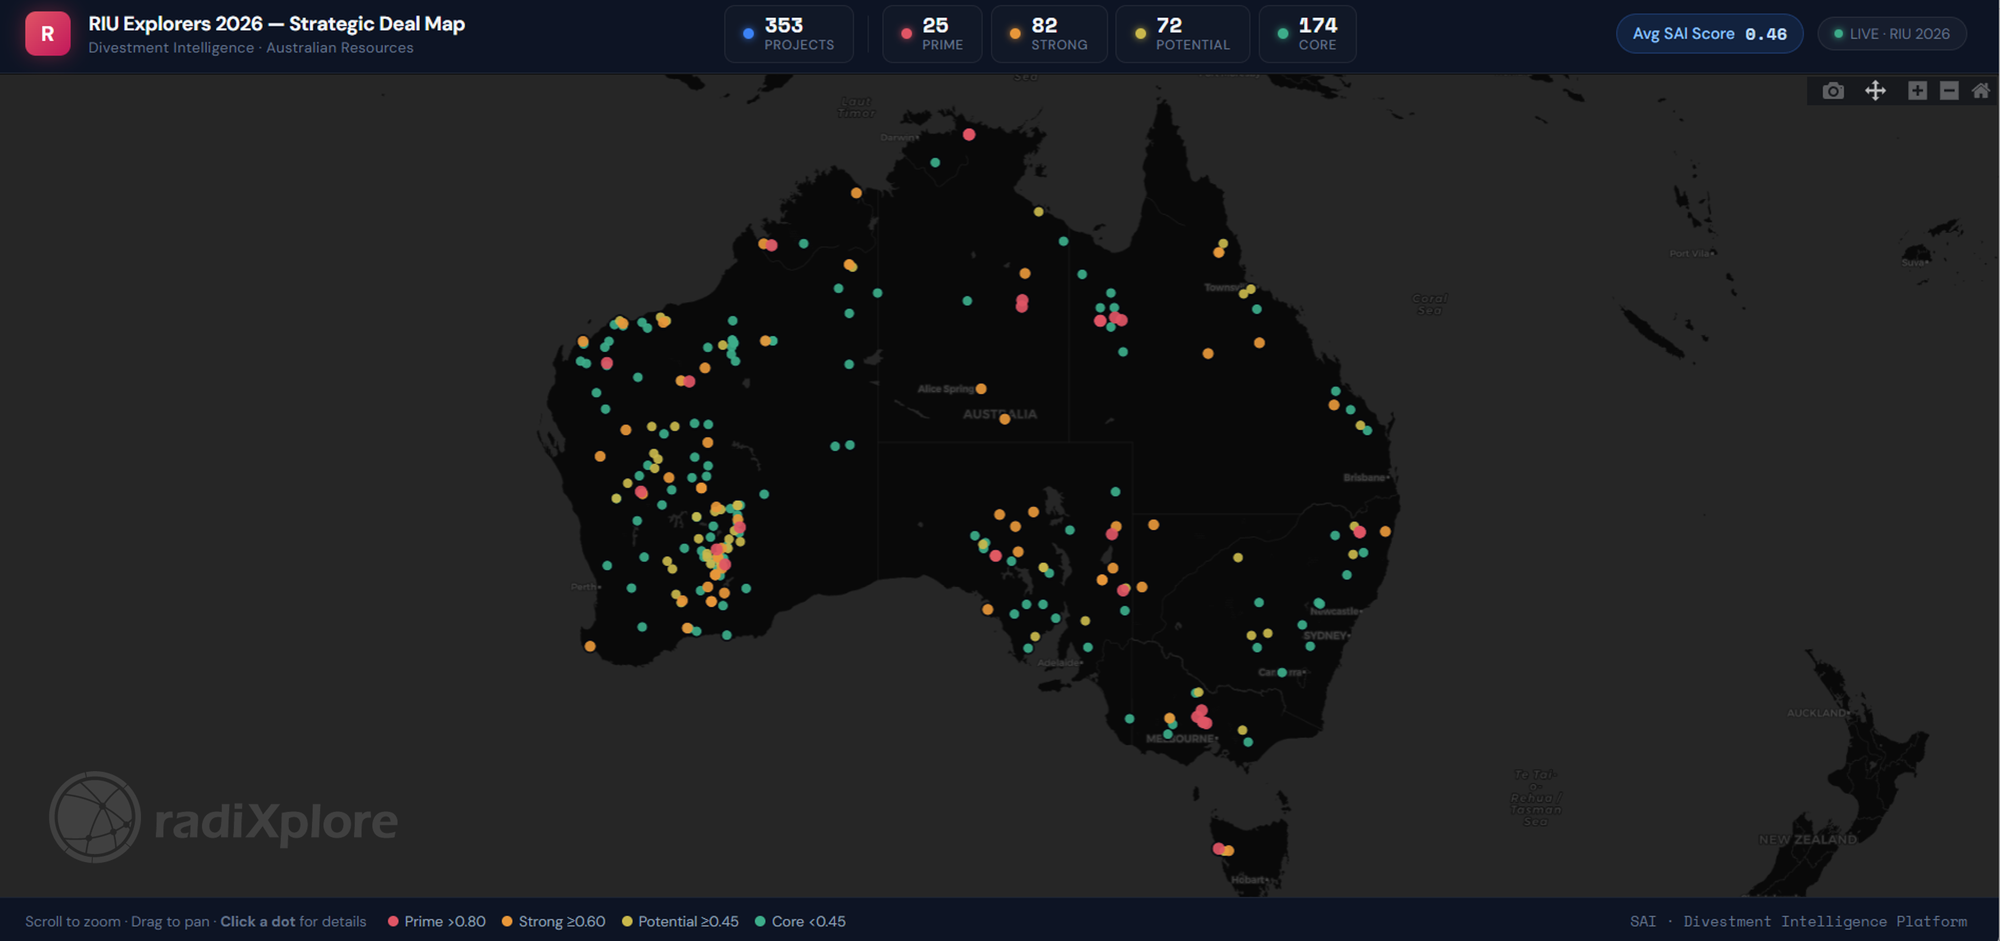
Visualizing the Market: The Strategic Deal Map
To make these insights actionable, we have mapped the entire conference cohort into an interactive intelligence platform. This map visualises strategic tension across the continent.
Click here to access the fully interactive RIU Strategic Deal Map
How to Use This Map
Whether you are an investor, an acquirer, or an explorer, this map allows you to see the market's structure in seconds.
- 🔴 Red Dots (Prime Targets): These represent assets with high strategic tension-usually due to a geographic mismatch (e.g., a WA company holding a remote QLD asset) or a commodity mismatch.
- Interpretation: These are potential acquisition targets. The owner may be open to a JV or sale to fund their core business.
- 🟢 Green Dots (Core Assets): These are the "Crown Jewels." They align perfectly with the company's location and commodity focus.
- Interpretation: If you see a large Green bubble, it represents a company playing to its strengths in its home jurisdiction. These are often lower-risk investment targets.
- Bubble Size: The size of the dot represents the scale of the Mineral Resource. A large Red dot indicates a major deposit that might be undervalued because it sits outside the owner's core focus.
Note: To ensure clarity, the default view of the map filters out early-stage tenements with minimal market visibility, focusing on the projects that drive value.
Conclusion: The Efficiency Dividend
The 2026 Australian exploration landscape is defined by a move toward capital efficiency. The winners will be the companies that have the discipline to monetize their non-core assets-generating cash without dilution-and focus that firepower on their flagship discoveries.
We are exhibiting at RIU Explorers 2026 Freemantle!
Come say hi to the RadiXplore team at booth #86. We can show you where your company sits on the map and discuss how data can help optimize your portfolio strategy.
Email: contactus@radixplore.com
Website: www.radixplore.com
Legal Disclaimer
This report and the information contained herein are for informational and educational purposes only and do not constitute an offer to sell or the solicitation of an offer to buy any security. The analysis provided is based on data obtained from public sources believed to be reliable, but RadiXplore does not guarantee its accuracy, completeness, or timeliness. The content of this report should not be construed as investment, financial, legal, or tax advice.