Unlocking Insights from Minerals ASX Announcements Using Geoscience Text Classification Models
Explore how our geoscience text classification model analyzes ASX announcements, revealing insights into categories like Operations, Finance, and Geology. Discover trends and patterns with our interactive treemap and other visualizations for a deeper understanding of mining sector communications.


Mining reports are much more than just geological data. These documents often contain valuable insights into a wide range of topics, including financial information, operational updates, exploration activities, and environmental impacts. For companies involved in mineral exploration, it’s crucial to understand and categorize the diverse themes contained within these reports. By analyzing both the geological and non-geological elements, stakeholders can make more informed decisions from both an exploration and financial perspective.
At RadiXplore, we recognized the need to effectively categorize these complex mining reports to unlock their full potential. To achieve this, we developed a sophisticated AI-driven geoscience text classification model. This model, built on a comprehensive dataset of historical relinquishment reports across Australia, enables us to accurately identify and classify various themes within the text. Our goal was to extend this capability to more current data sources and apply our model to ASX announcements from mining companies to uncover unique insights and patterns that might otherwise remain hidden.
Categorizing Mining Reports: Key Themes
To ensure a comprehensive analysis of mining reports, we categorized the data into the following key classes, each representing a crucial aspect of mining operations and exploration:
| Class | Description |
|---|---|
| Codes | Regulatory and procedural codes related to mining activities. |
| Community Affairs | Social responsibility, community engagement, and local impact. |
| Drilling | Information on drilling activities, methodologies, and outcomes. |
| Economics | Economic factors, including market conditions and resource value. |
| Engineering | Engineering design, construction, and infrastructure considerations. |
| Environment | Environmental impact, sustainability, and compliance issues. |
| Finance | Financial data, investments, and funding related to mining projects. |
| Geochemistry | Chemical composition and analysis of geological samples. |
| Geology | Geological formations, structures, and mineral deposits. |
| Geophysics | Geophysical surveys and subsurface exploration methods. |
| HSSE | Health, safety, security, and environmental protocols. |
| Hydrology | Water resources and management in relation to mining operations. |
| Laboratory | Lab testing and analysis of mining samples. |
| Legal and Commercial | Legal frameworks, contracts, and commercial agreements. |
| Operations | Day-to-day mining operations and management. |
| Project Management | Planning, execution, and oversight of mining projects. |
| Quality Procedures | Quality control processes and standards. |
| References | Citations and references used in mining reports. |
| Regulatory | Government regulations, compliance, and permits. |
| Remote Sensing | Use of satellite imagery and aerial surveys for exploration. |
| Surveying | Ground-based surveys and mapping techniques. |
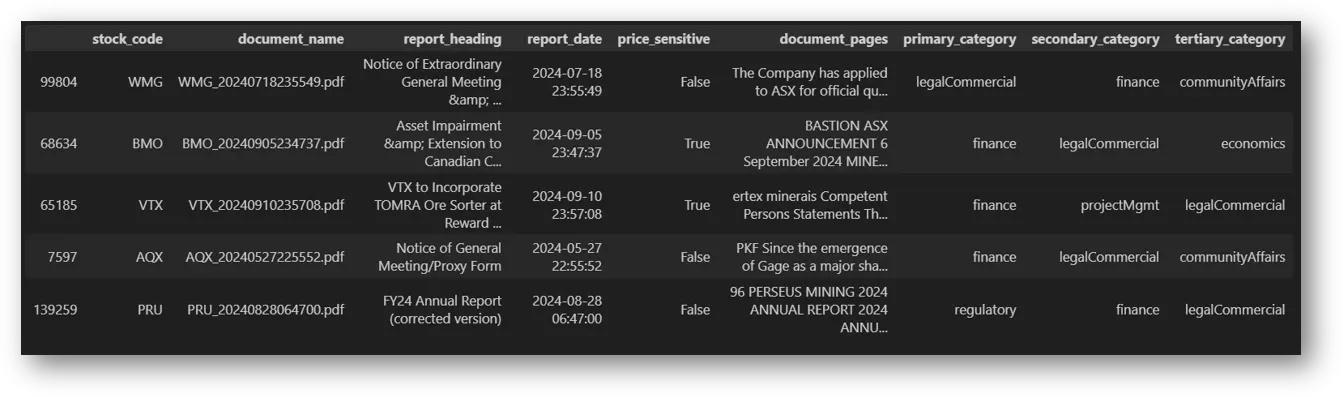
Before diving into the classification categories, let's first analyze our dataset for some basic insights. Below is a random sample of 10 rows from the dataset.
Announcement Trends:
By plotting the number of announcements over time, we can identify key trends or seasonal patterns in the mining industry. This type of analysis can reveal periods of heightened activity, such as increased exploration efforts during specific months or financial announcements tied to fiscal reporting. Spotting these trends helps stakeholders understand the timing of critical operations and plan resources accordingly, offering insights into the cyclical nature of mining activities.
Seasonal Fluctuations: There seem to be seasonal patterns, with potential peaks around certain months (e.g., June and July). This could be attributed to factors such as financial reporting periods or company events.
Top 20 Companies by Number of Announcements:
Our analysis of ASX announcement frequency reveals that Westgold Resources (WGX) is the most active company in terms of market communication over this period. This could indicate a variety of factors, such as significant operational activity, ongoing project developments, or challenges that require frequent updates. While a high volume of announcements can signal transparency and investor engagement, it's essential to consider the quality and relevance of the information. By analyzing both the frequency and content of announcements, we can gain valuable insights into a company's status, strategy, and potential future directions in the mining sector.
Westgold Resources (WGX) Announcements Categorized by Topics:
Using our geoscience AI text classification model, we can identify which categories the majority of Westgold Resources (WGX) announcements fall into. This allows us to see the dominant themes and topics within their disclosures.
Operational and Financial Updates: Regular updates on operations and finance are also common.
Community Engagement: While less frequent, WGX does address community affairs.
Visualizing ASX Announcement Classifications with a Multi-Level Treemap
After categorizing the announcements, it's essential to visualize the distribution of these classifications to better understand how the data is structured. One powerful way to do this is through a multi-level treemap, which not only highlights the most frequently predicted categories but also gives us insight into the relationships between primary and secondary classifications.
The multi-level treemap provides a hierarchical visualization of the classifications generated by our geoscience AI text classification model, applied to ASX announcements. The outer layer of the treemap represents the primary classification (Class 1), which includes high-level categories such as Operations, Finance, Geology, and Environment. These are the top-level topics that the model predicts as the most relevant to the content of each announcement.
Within each of these primary classifications, the inner layer reveals the secondary classification (Class 2), offering a deeper level of insight. For instance, within the Operations category, the secondary classification could include subtopics like Drilling, Project Management, or Regulatory. Similarly, under Finance, subcategories such as Economics or Legal and Commercial might appear.
The size of each rectangle within the treemap corresponds to the frequency of announcements that match each classification combination. Larger rectangles represent classifications that occur more frequently, indicating where certain themes—such as Geology and Drilling or Finance and Economics—tend to co-occur.
This treemap not only highlights how often specific topics are discussed but also provides insight into the relationships between different themes. It shows where the model’s confidence in a primary classification leads to distinct secondary classifications, or where there is a high overlap of related themes, such as in finance-related or exploration-related announcements.
By examining this visualization, we can see patterns and correlations in the data, helping to identify areas of focus for mining companies and potential trends in the industry.
Click into the treemap to see how categories overlap and reveal insights about the mining industry's key areas of focus.
To dive deeper into the data, explore the interactive treemap below. By clicking on each section, you can uncover detailed insights into the classifications of ASX announcements. The dynamic nature of the chart allows you to zoom in on specific categories like Operations or Finance, and discover how they break down into more granular subtopics such as Drilling, Project Management, or Economics.
Heatmap Analysis: Understanding Company Announcements
The heatmap provides a visual representation of the distribution of announcement types across the top 10 companies. Each company is represented by a row, and each category of announcement is represented by a column. The color intensity of each cell indicates the proportion of announcements in that category for the corresponding company.
By examining the heatmap, we can identify:
- Industry-wide trends: Common categories across multiple companies
- Company-specific strategies: Variations in announcement types among different companies
- Unique areas of focus: Companies with distinctive areas of emphasis
- There are variations in the distribution of other categories among companies, indicating diverse strategic focuses.
- Some companies have unique areas of emphasis, suggesting potential competitive advantages.
In conclusion, the analysis of ASX announcements through our geoscience text classification model and the interactive heatmap provides a comprehensive view of industry trends and company focus. These tools offer valuable insights into the mining sector, but the exploration doesn’t stop here.
To take your analysis to the next level, we invite you to experience RadiXplore. Our platform allows you to delve deeper into ASX announcements using advanced GeoAI technology, compare findings with Open File historic data, and make more informed decisions based on comprehensive and up-to-date information.
Ready to enhance your analysis? Sign up for free today and start exploring with RadiXplore. If you have any questions or need further assistance, don’t hesitate to contact us. Discover how RadiXplore can transform your approach to mining data and unlock new opportunities for your business.