Mining M&A at RIU Sydney 2026: 32 ASX Divestment Targets Hiding in Plain Sight
Strategic Asset Index analysis of 819 projects from RIU Sydney 2026 reveals 32 Prime and Strong divestment candidates across ASX-listed juniors. Interactive deal map and component-level reasoning included.

Executive Summary: The Stranded-Asset Layer at RIU Sydney 2026
The RIU Sydney Resources Roundup is positioned as Sydney's premier explorer-meets-investor showcase. Underneath the pitch decks and drilling updates, the data tells a quieter story - one that matters more for corporate development teams than for the brokers in the room.
RadiXplore analysed 819 projects belonging to ASX, TSX, TSXV and CSE companies presenting at RIU Sydney 2026 using the Strategic Asset Index (SAI), our quantitative framework for detecting structural portfolio misalignment.
32 of those projects (3.9%) qualify as Prime or Strong divestment candidates. Another 74 sit in the Potential tier. Together, that's 106 ASX-listed projects exhibiting measurable divestment pressure before a single transaction has been announced.
The most extreme case in the dataset: an ASX-listed gold company holding two Brazilian lithium projects 9,600 km from its core operations.
These aren't distressed assets. Most are technically credible - many have JORC resources, advanced exploration permits, and active drilling programs. They're flagged because they don't fit the company holding them. For mid-tier producers, mining private equity, and commodity-specialist juniors, this is concentrated off-market deal flow.
This post walks through the analysis, the interactive intelligence layer, and the specific patterns worth knowing before you walk the conference floor.
Methodology: How the Strategic Asset Index Works
The SAI scores every project between 0.0 (core strategic asset) and 1.0 (prime divestment candidate) by combining four components:
- Commodity Mismatch (20% weight) - how aligned the project's commodity is with the company's maturity-weighted commodity focus
- Geography Mismatch (20% weight) - three-tier grading: same country & state (0), same country only (0.5), different country (1.0)
- Isolation (30% weight) - within-company average distance to the project's three nearest sister projects, percentile-ranked across the entire market
- Buyer Synergy (30% weight) - exponential-decay distance to the nearest commodity-aligned competitor, with companion density scoring
Weights renormalise dynamically when a component cannot be computed (typically synergy in countries with no comparable peer). Each project also receives a confidence score based on how many components contributed real data.
A high SAI score is not a valuation call. It's a structural signal that the asset is more valuable in someone else's hands.
For full methodology context, see our PDAC 2026 analysis and RIU Explorers 2026 Fremantle deep dives.
Tier Calibration
The thresholds used in this analysis are calibrated against the post-correction RIU Sydney distribution rather than carried forward from the original methodology. The shape of the score distribution at this conference is tighter than at PDAC - a smaller, more focused cohort with fewer extreme bicontinental portfolios - so the tier cutoffs are calibrated accordingly:
- Prime: ≥ 0.85 - 5 projects (~0.6%)
- Strong: 0.70 - 0.85 - 27 projects (~3.3%)
- Potential: 0.55 - 0.70 - 74 projects (~9.0%)
- Core: < 0.55 - the remaining ~86%
Track Record: 42% Forward Detection Rate
The Strategic Asset Index has been backtested against historical mining divestments across multiple conference cohorts. Across known transactions, SAI identified 42% of divestments prior to public announcement.
In mining M&A - where political, financing, and operational complexity routinely bury structural signals - a 42% forward-detection rate is materially significant. Past validated cases include:
- FireFly Metals - Pickle Crow Gold Project - flagged as non-core; subsequently divested for A$86.1M.
- Velocity Minerals - Zlatusha Project (Bulgaria) - flagged due to geographic isolation; divested in 2025.
- Starcore International - Ajax Project (Canada) - flagged due to jurisdictional misalignment; spun out in 2026.
The signal is real. The question is who acts on it before the announcement.
The Interactive Strategic Deal Map
Every project in the RIU Sydney 2026 dataset is plotted geographically, coloured by SAI tier. Click the image to access the live interactive Deal Map - this is a screening tool, not a static visualisation.
How to Use the Deal Map
1. Toggle Divestment Layers via the Legend
The default view shows Prime, Strong, and Potential tiers only. Click the Core legend item to add the full universe back in for context. Double-click any tier to isolate it.
2. Zoom by Jurisdiction
The default view is Australia-centred (most ASX-listed projects sit here), but the Prime list includes assets in Brazil, Thailand, Italy, Namibia and the United States. Zoom out and pan to see the full off-shore footprint of Australian-domiciled juniors.
3. Click Any Project for Asset-Level Detail
Each marker reveals owner, ticker, project location, development stage, primary commodity, the SAI score with a visual indicator bar, and (one click further) the structural reasoning behind the score.
4. Use It as a Deal Filter
The highest transaction probability emerges where the SAI score is high and the project sits within bolt-on distance of an in-commodity competitor. The Deal Map exposes both signals simultaneously.
Divestment pressure plus infrastructure adjacency equals elevated M&A probability.
The Reasons-Stack: Why Each Top Project Scores
A black-box ranking is useful for screening. It is not useful for outreach.
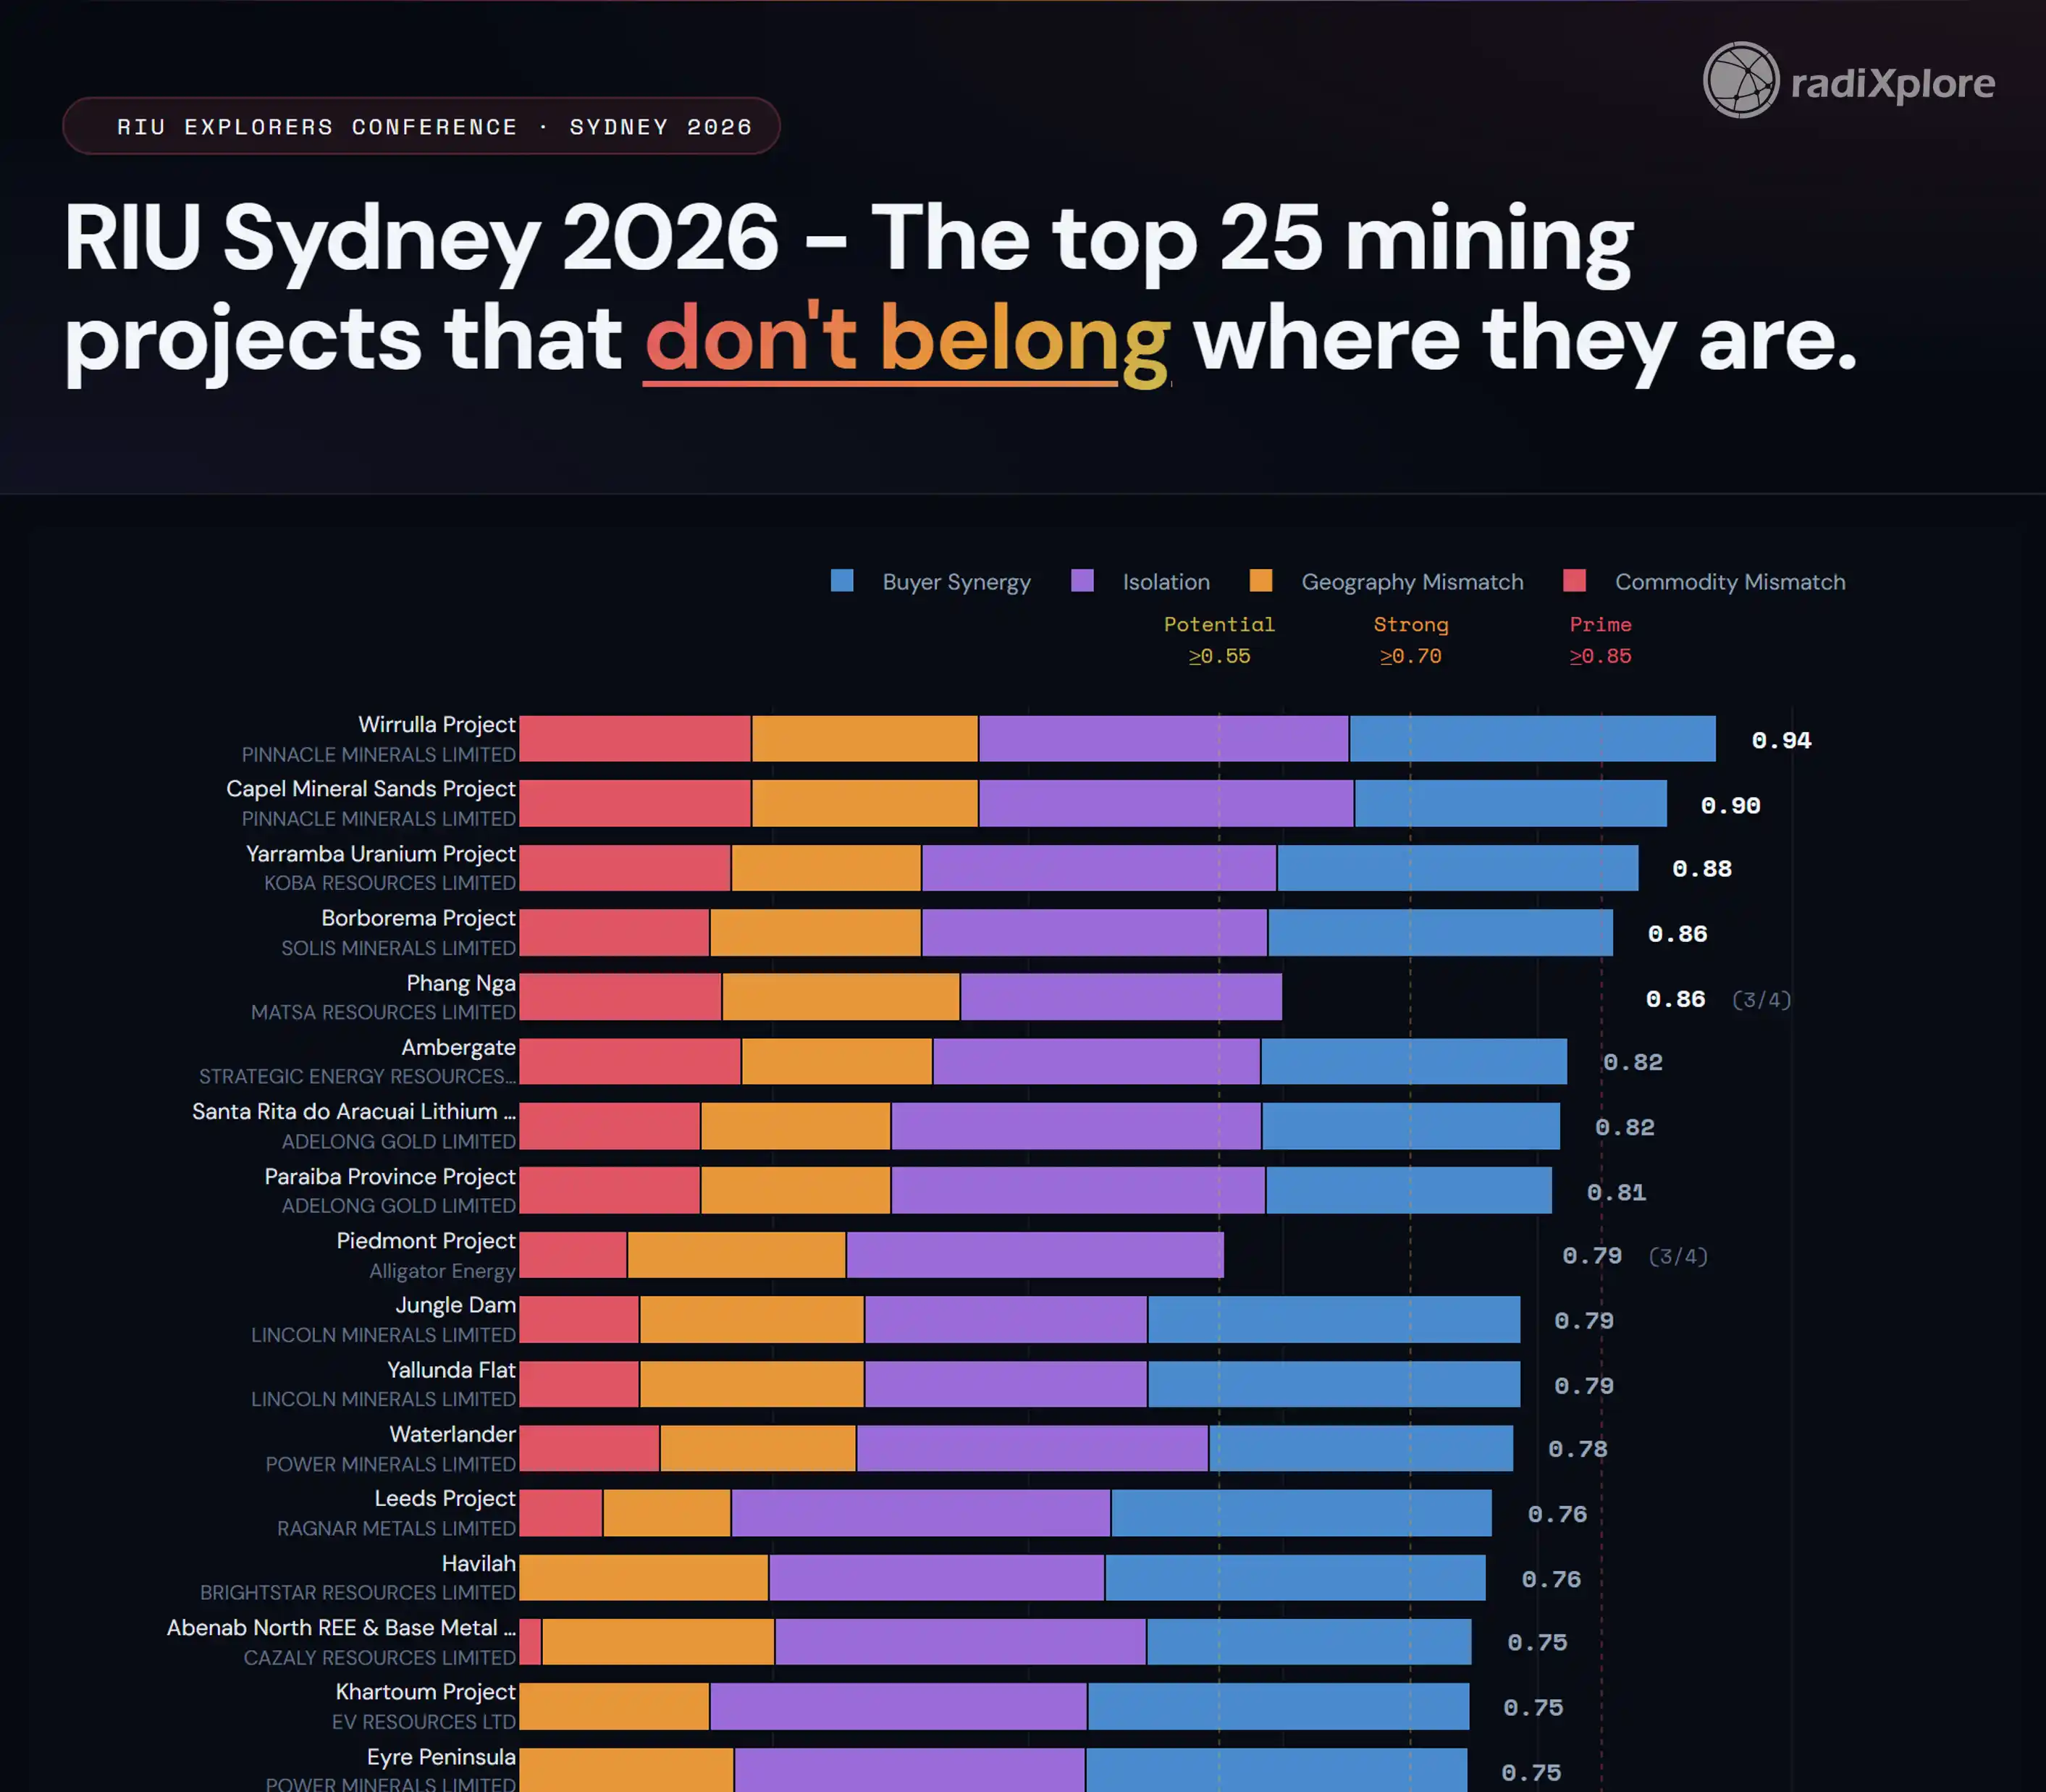
To support due-diligence-grade conviction, every Prime and Strong project is also presented as a stacked-bar breakdown of the four SAI components. Click the image below to access the live Reasons-Stack chart.
Each bar shows the project's score, segmented by component contribution. A balanced four-segment bar - visible commodity mismatch, geography mismatch, isolation, and synergy - signals a structurally non-core project with multiple independent reasons to divest. A single-segment bar means the score is driven by one factor only, and warrants closer scrutiny.
Bars with a missing segment indicate a component the engine could not compute - typically Buyer Synergy when no comparable peer exists in that country. The score is still valid; it's based on three of four components instead of four.
This is the credibility layer. It turns "Pinnacle Wirrulla scores 0.94" into "Pinnacle Wirrulla scores 0.94 because all four structural signals are firing - non-core commodity, non-core country, extreme isolation, and a nearby commodity-aligned competitor."
Five Patterns from RIU Sydney 2026
1. The Brazilian Lithium Cluster
Four Prime/Strong projects sit in Brazil, holding battery-and-tech-metals or pure lithium, with an average SAI score of 0.804 - and they're held by three distinct ASX juniors:
- Solis Minerals - Borborema Project (Prime, 0.86) - a lithium-bearing pegmatite system in Rio Grande do Norte, held by a Peru-focused base-metals explorer.
- Adelong Gold - Santa Rita do Araçuaí Lithium Project (Strong, 0.82) - Minas Gerais lithium, held by an Australian gold company.
- Adelong Gold - Paraíba Province Project (Strong, 0.81) - second Brazilian lithium asset under the same Australian gold company.
- Power Minerals - Niobio (Strong, 0.73) - Brazilian battery-and-tech-metals for an Argentina-focused lithium company.
This isn't a coincidence. It's a sector-wide signal: small-cap explorers picked up Brazilian lithium ground during the 2022-2024 acquisition cycle, and as capital tightens, these assets are migrating toward operators with matched commodity and geographic focus.
For Brazilian-focused lithium specialists, this is an off-market shopping list with three sellers and four assets.
2. The Australian Uranium Concentration
Three Prime/Strong projects in Australian uranium, held by three different juniors, average 0.842 - the highest cluster average in the dataset:
- Pinnacle Minerals - Wirrulla Project (Prime, 0.94) - REE+Uranium in South Australia, held by a US-antimony-focused junior.
- Aruma Resources - Wilan Project (Strong) - South Australian uranium near Olympic Dam, held by a precious-metals-focused junior.
- Koba Resources - Yarramba Uranium Project (Prime, 0.88) - South Australian uranium, held by a battery-metals junior.
Three companies, three uranium assets in South Australia, none with uranium as their stated core. With the Honeymoon mine restart driving local consolidation activity, this is a textbook bolt-on cluster for uranium-focused acquirers.
3. The Tasmanian Stranded-Asset Pattern
Tasmania is small geographically but punches above its weight in the Strong tier. Three projects from three different juniors:
- Dynamic Metals - Prospect Ridge Magnesite (Strong, 0.74) - Tasmanian magnesite for a Western Australia-focused base-metals junior.
- Elementos - Cleveland Tin Project (Strong, 0.73) - Tasmanian tin for a Spain-focused tin company. Highest within-portfolio isolation in the dataset at 17,517 km.
- Rokeby Resources - Mt Read (Strong, 0.73) - Tasmanian battery-and-tech-metals for a Northern Territory-focused junior.
The pattern: companies headquartered elsewhere are unable to give Tasmanian assets the management bandwidth they deserve. For Tasmanian-focused or Eastern Australian aggregators, these projects represent natural consolidation targets.
4. The Multi-Project Outliers
Five companies appear with two or more Prime/Strong projects each. These are corporate-level outreach candidates rather than single-asset divestment stories:
- Pinnacle Minerals (PIM) - 2 Prime: Wirrulla (REE+U) and Capel Mineral Sands. A US-focused junior holding two stranded Australian projects in distinct commodity verticals.
- Adelong Gold (ADG) - 2 Strong, both Brazilian lithium. The most pronounced commodity-and-geography misalignment in the dataset.
- Power Minerals (PNN) - 3 Strong: Waterlander (WA), Eyre Peninsula (SA), and Niobio (Brazil). A scattered Argentina-focused lithium portfolio.
- Lincoln Minerals (LML) - 2 Strong: Yallunda Flat and Jungle Dam. Both NSW projects under a South Australia-focused junior.
- Metalsgrove Mining - 2 Strong: Leake and Edward Creek. Australian assets under a Côte d'Ivoire-focused company.
These are not the projects the analyst desk should call; these are the CEOs.
5. The Confidence-Flagged Cases
Two of the highest-scoring projects in the analysis carry partial-component scores - worth flagging because they require a different conversation:
- Matsa Resources - Phang Nga (Thailand) - Prime (0.86), but synergy could not be computed because there's no comparable lithium-tin peer in Thailand. The score is based on commodity, geography, and isolation only.
- Alligator Energy - Piedmont Project (Italy) - Strong (0.79), same situation: the only Northern Italian PGE-Ni asset in the dataset.
For these projects, the absence of a local buyer is part of the story. The owner cannot easily monetise these assets through a domestic transaction; they require either a corporate-level deal or a strategic acquirer willing to enter a new jurisdiction.
High-Conviction Mining Acquisition Targets
Based on structural scoring and synergy overlays, three projects rank as the highest-conviction candidates at RIU Sydney 2026.
Pinnacle Minerals - Wirrulla Project (South Australia)
- SAI Score: 0.94 (Prime, Multi-factor driver)
- Structural drivers: REE+Uranium in Australia for a US-focused antimony-and-precious-metals junior. 9,700 km from peers. Commodity-aligned competitor 63 km away.
- Implication: This is the cleanest divestment signal in the dataset. Pinnacle's operational focus is in Idaho; their Australian REE/uranium ground is a candidate for outright sale or spin-out.
Solis Minerals - Borborema Project (Brazil)
- SAI Score: 0.86 (Prime, Multi-factor driver)
- Structural drivers: Lithium-pegmatite in Rio Grande do Norte for a Peru-focused base-metals explorer. Commodity-aligned competitor 15 km away - among the strongest synergy signals in the dataset.
- Implication: A Brazilian lithium specialist with operations in the Northeast pegmatite belt could acquire this as an immediate bolt-on. The 15 km buyer-synergy distance is unusually tight.
Koba Resources - Yarramba Uranium Project (South Australia)
- SAI Score: 0.88 (Prime, Multi-factor driver)
- Structural drivers: Uranium for a battery-metals-focused company. 17 km from Boss Energy's Honeymoon mine. 4.6 Mlbs U₃O₈ JORC 2004 resource at the Oban Deposit.
- Implication: Adjacency to Honeymoon and the regional uranium revival makes this a textbook regional consolidation target for any Australian uranium-focused operator.
The Strategic Lesson
Three RadiXplore conference analyses now - Diggers & Dealers 2025, PDAC 2026, RIU Sydney 2026 - show the same underlying pattern: the explorer ecosystem is structurally over-diversified relative to the capital it can sustain.
In a tight-capital environment, the companies that win are not the ones with the most projects. They are the ones that recognise which of their projects don't belong, and find them better homes - generating non-dilutive cash to fund their flagship assets.
The RIU Sydney 2026 cohort offers 32 such opportunities. The capital efficiency gains are there for any operator willing to look at the data.
Access the Full Mining M&A Dataset
The 32 projects highlighted in this post are the public summary tier. RadiXplore provides:
- Full access to all 106 Prime, Strong, and Potential RIU Sydney 2026 candidates
- Component-level scoring with confidence flags for due-diligence integration
- Confidential mining portfolio benchmarking against the SAI framework
- Bespoke Strategic Portfolio Briefings for corporate development teams
Mining M&A advantage accrues to those who quantify structural pressure before it becomes public.
Email: contactus@radixplore.com Website: www.radixplore.com
Book a Strategic Portfolio Briefing
Request a private demonstration of the Strategic Opportunity Platform to identify off-market mining acquisition targets aligned with your jurisdictional and commodity strategy.
Legal Disclaimer
This report is for informational purposes only and does not constitute investment, financial, legal, or tax advice. All analysis is derived from publicly available data believed to be reliable but not guaranteed. Mining investments involve risk. Readers should conduct independent due diligence before making investment decisions.
Any views expressed regarding individual companies are based on publicly available information and the structural patterns observed in the Strategic Asset Index. They do not reflect any private knowledge of corporate intent.