
21 Noosa Mining Conference 2026 Projects That May Be Worth More in Different Hands
RadiXplore mapped 451 projects held by Noosa Mining Conference 2026 exhibitors and scored 419 of them for strategic fit and market momentum. Twenty-one stood out

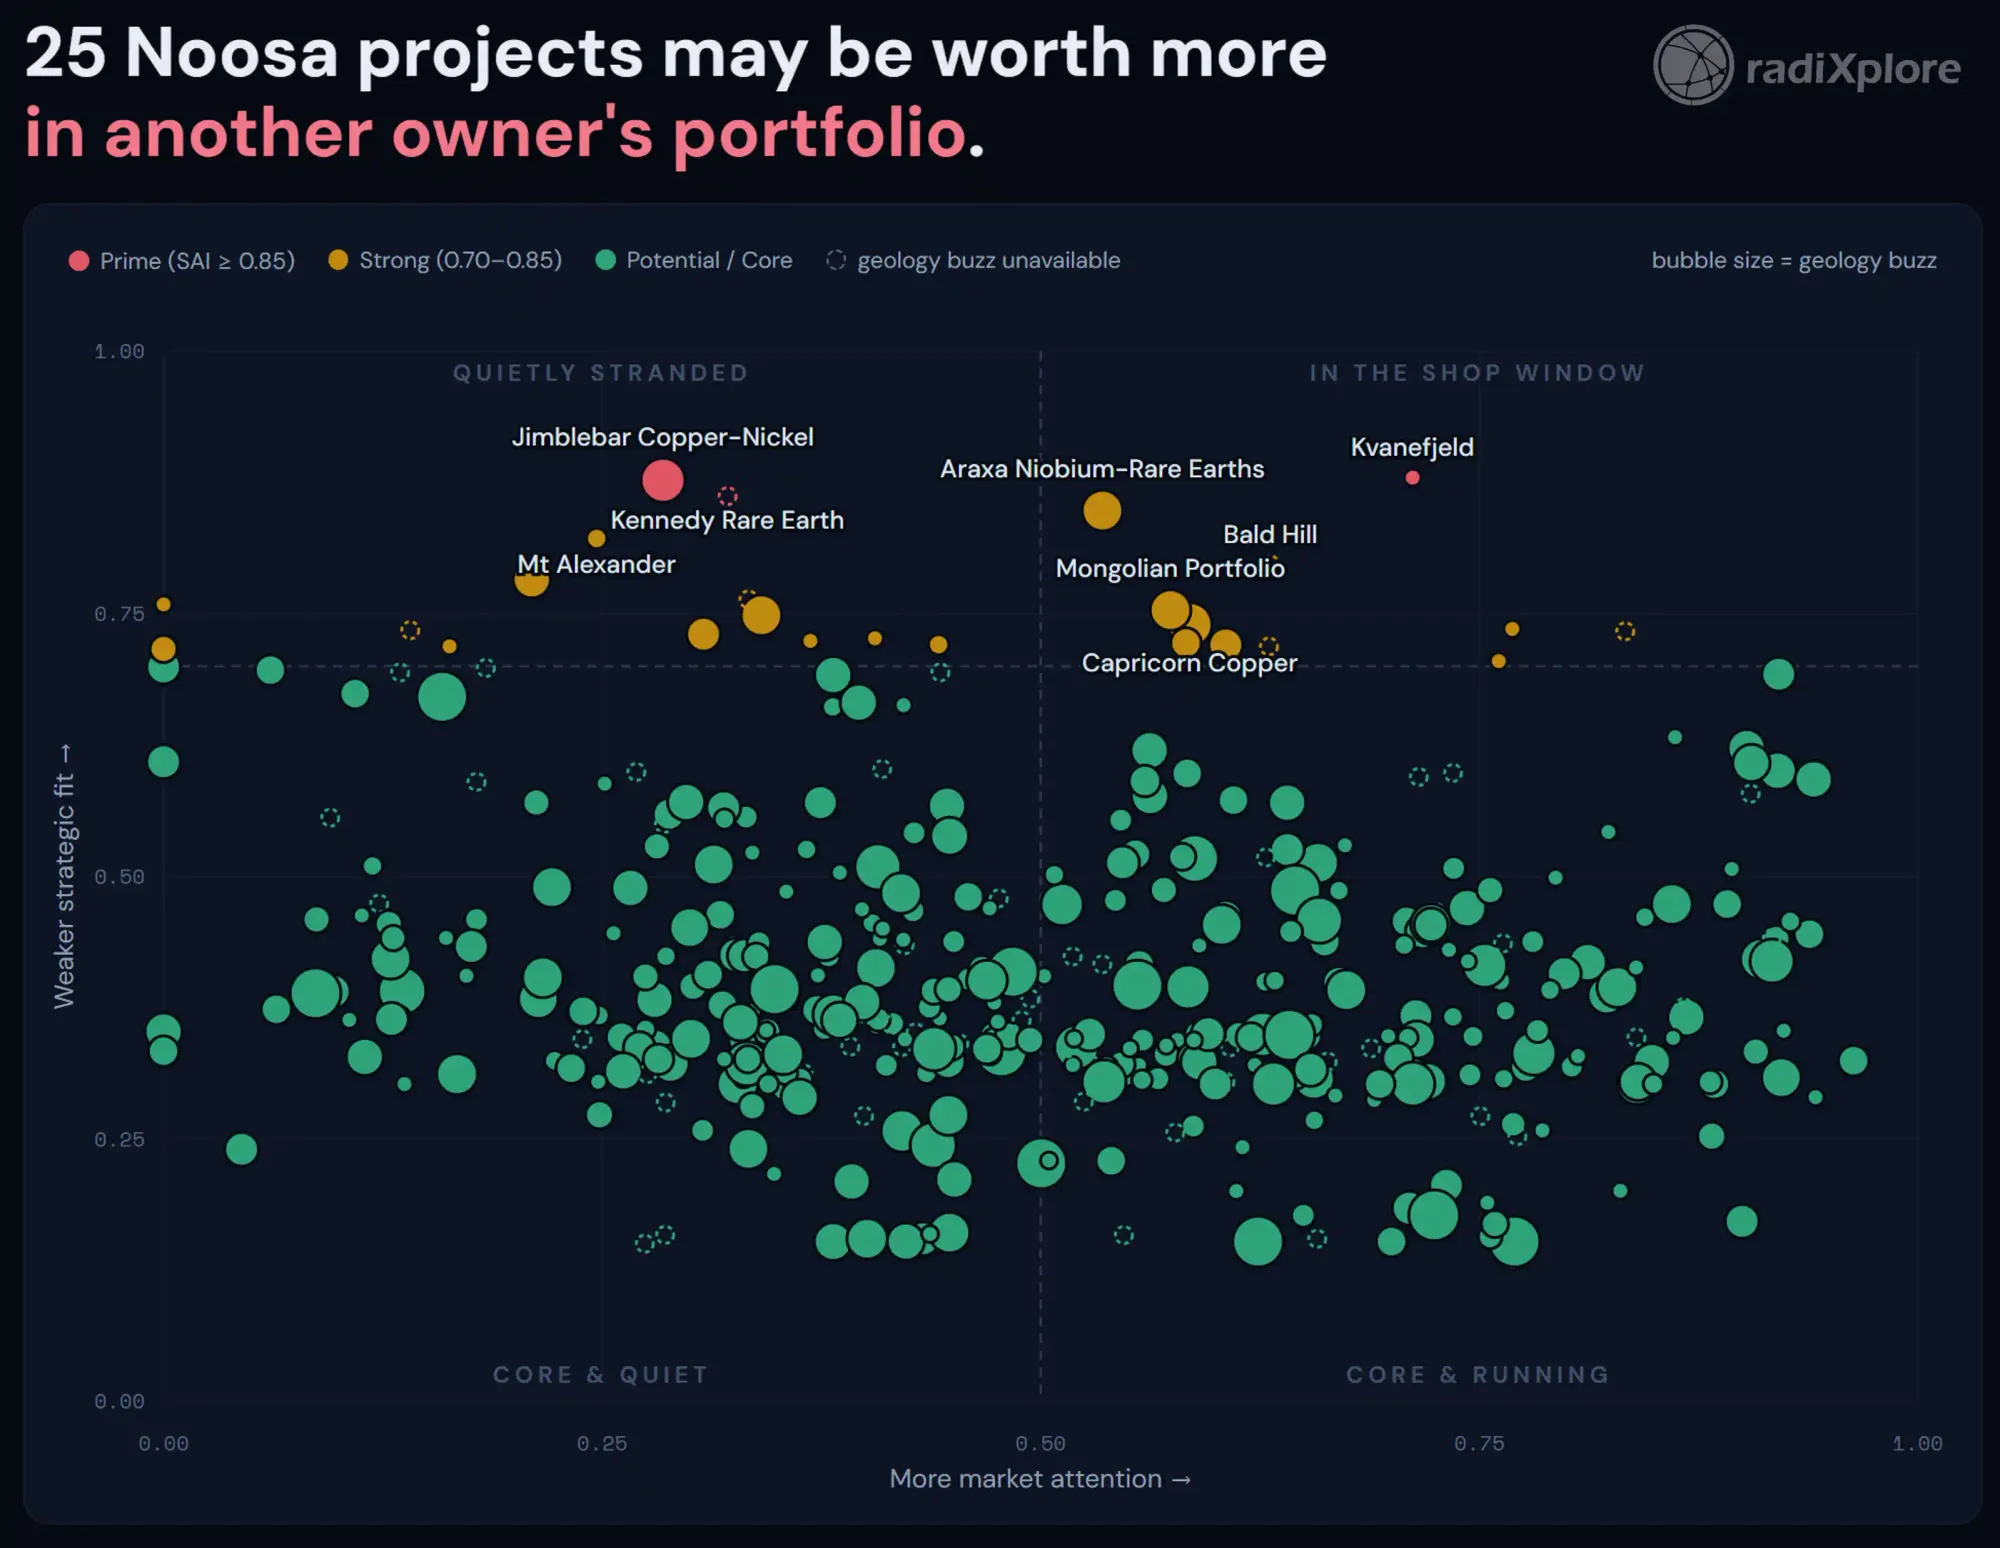
We scored every project heading to Noosa 2026 on two questions at once: does it fit its owner, and is the market watching? The crossover is where the deals hide.
We mapped 451 projects held by 72 Noosa 2026 exhibitors and had enough data to score 419. Twenty-one appear strategically misplaced. Ten are already attracting attention. Eleven are quietly stranded.
Executive summary
Last year, we scored Noosa exhibitors on strategic fit. This year, the analysis is sharper-and it adds a second axis.
We mapped 451 projects held by the 72 companies presenting at Noosa 2026 and had enough data to score 419 of them. Every project was benchmarked against more than 10,000 mining projects across the ASX and the Canadian exchanges, including the TSX, TSXV and CSE.
That means a high score is unusual by the standards of the wider market, not just the companies attending Noosa.
Each project receives two independent reads:
- Strategic misfit: Does the asset fit its owner by commodity, region and distance from the rest of the portfolio?
- Market momentum: Is the market paying attention to it right now?
We have explained the thdory behind both measures in separate pieces.
 Russell Menezes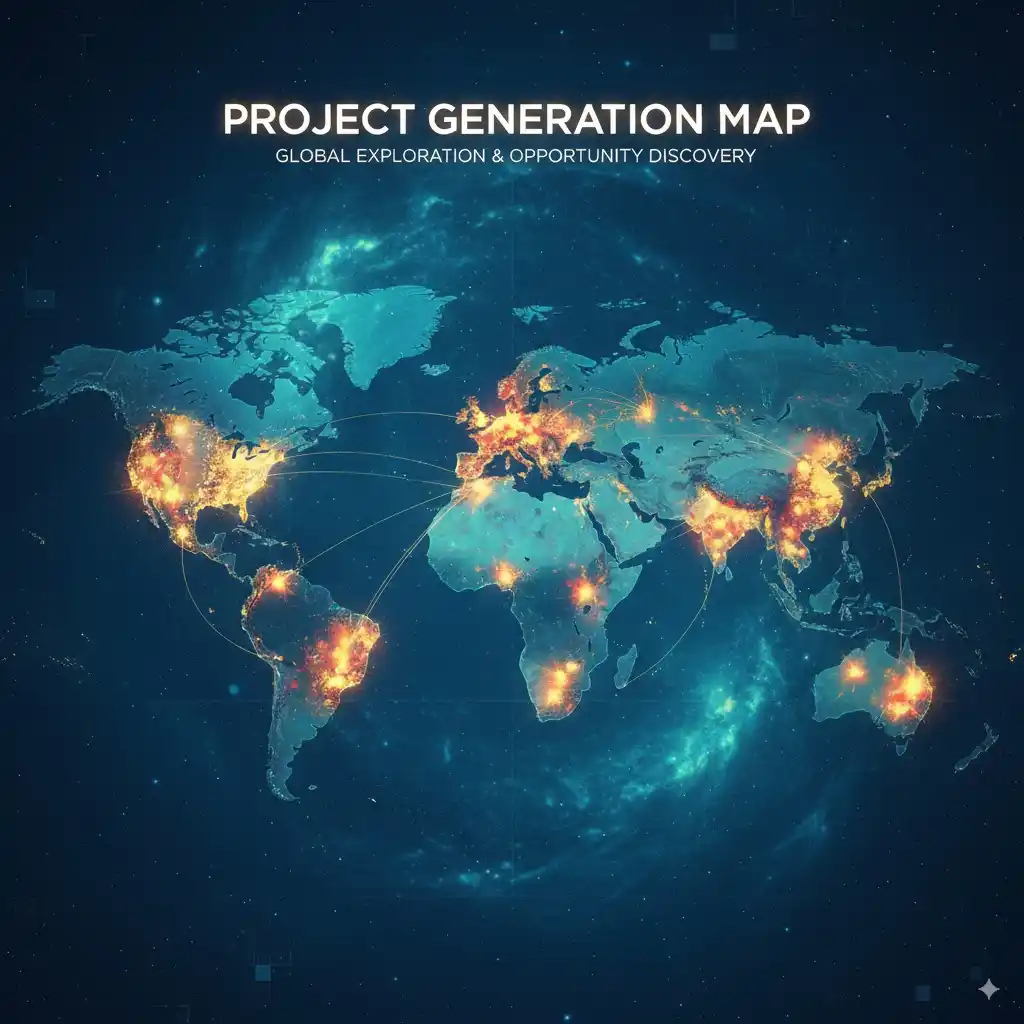
The strategic-fit side - divestment potential
 Russell Menezes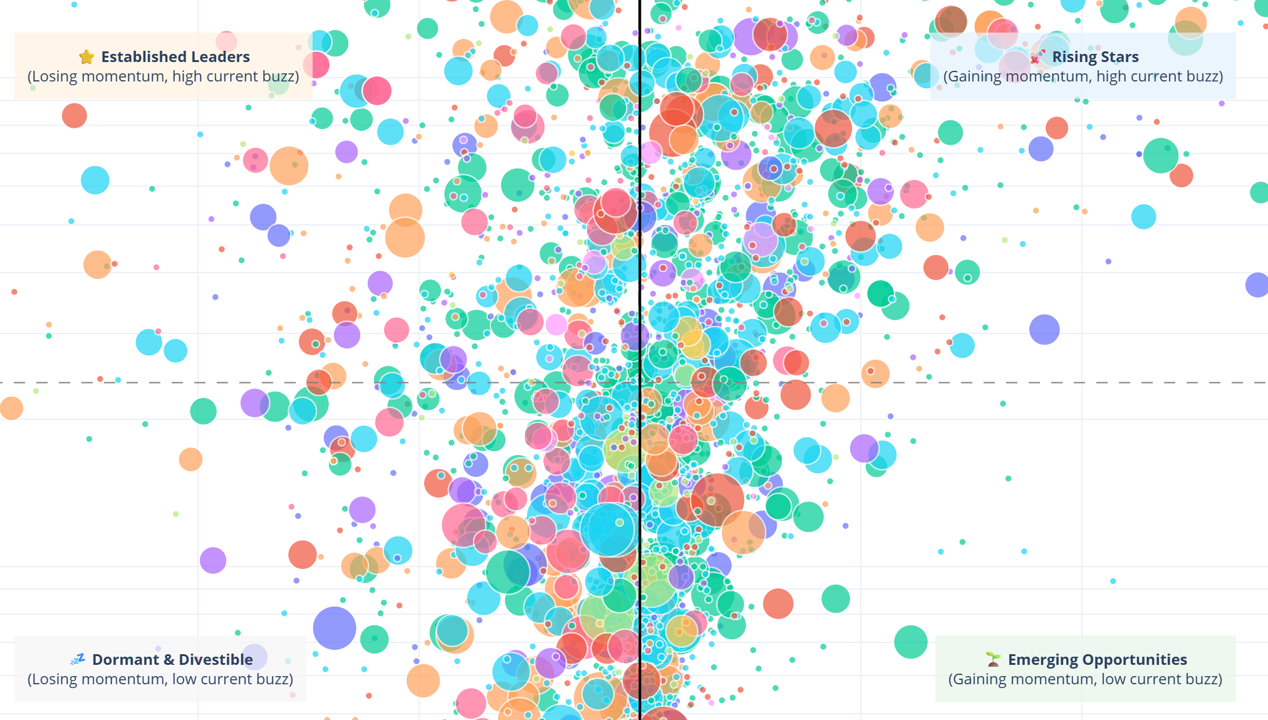
How we measure market attention
Integrating the two methods reveals:
- 21 projects that appear strategically misplaced and may warrant closer portfolio review.
- 10 hot misfits receiving strong market attention-assets already in the shop window.
- 11 quietly stranded projects with high misfit and low attention-the more genuinely off-market opportunities.
There is also a third layer previous editions did not have. For every project mention, we can now distinguish whether the news is being driven by the drill bit or the corporate calendar. That is represented by bubble size in the chart below. We call it the Geology Buzz Score.
Important: This is a screen for strategic-fit and market-attention signals. It is not a valuation, a statement that an asset is for sale, or a recommendation to buy, sell or hold any security.
The Noosa 2026 momentum and M&A matrix
The chart below places every scored project on two axes.
- Moving up means the project appears less aligned with its current owner.
- Moving right means the project is receiving more market attention.
- Bubble size reflects the level of geological news activity surrounding the project.
The resulting quadrants tell four different commercial stories.
What is different this year
Readers of last year's Noosa analysis may remember the Strategic Opportunity Matrix. The methodology has since moved on in five ways that materially improve the ranking.
1. The scores now separate properly
Last year, dozens of projects tied at the top of the scale, making it difficult to distinguish the strongest candidates.
This year, the scores spread across the range. The highest score at Noosa is 0.88, with no pile-up at the ceiling, so the ranking is genuinely useful.
2. Every project is measured against the wider market
Last year, a project was only unusual relative to the other companies in the room.
This year, every project is ranked against more than 10,000 listed mining projects. A high score therefore carries weight beyond the conference itself.
3. Momentum is harder to fake
A company that only publishes a handful of announcements a year could previously appear highly active on the back of one release.
The updated model corrects for that. Momentum now reflects sustained project-level attention rather than a single loud day.
4. We read what the news is actually about
Not every project mention represents exploration progress.
We categorise whether the news is about:
- drilling,
- assays,
- geology,
- geophysics,
- studies,
- financing,
- permitting, or
- routine corporate administration.
A project named in a drilling report therefore registers differently from one that appears only in a standard tenement schedule.
5. Royalty and residual interests no longer trip the screen
A royalty holder or minority residual owner can appear at the same coordinates as an asset it does not operate.
Those cases are now filtered out where identified, reducing false strategic-misfit signals.
Flagged before the market caught up
Three projects on this year's exhibitor list were flagged purely on the way each asset sits inside its owner's portfolio-before later events made the tension more visible.
Score: 0.74, Strong
Capricorn Copper was flagged before the asset entered formal strategic review.
The point is not that the model predicted a specific transaction. It is that portfolio structure can reveal pressure before a formal process becomes visible to the market.
Score: 0.75, Strong
McPhillamys was written down after the 2024 permitting refusal, leaving its future under evaluation.
Its score reflects the way a major, capital-intensive project can become increasingly difficult to reconcile with the wider portfolio when external constraints change its development pathway.
Score: 0.88, Prime
Kvanefjeld remains stranded by Greenland's uranium ban and is now in arbitration.
It is the only Prime-tier project at Noosa that remains in the hot quadrant because the legal and policy story has continued to generate attention.
The broader pattern is simple:
The screen reads portfolio structure, and structure tends to move before the headlines do.
When a project is already in the news, the flag confirms what the market can see. The greater value lies in projects where the structure points to a problem-or an opportunity-the market has not yet focused on.
The four quadrants
In the shop window: 10 hot, strategically misaligned projects
High attention can work in a seller's favour because the asset is already visible while interest is running.
Names in this group include:
- Kvanefjeld, Energy Transition Minerals - Prime and surging.
- Araxa niobium-rare earths, St George Mining - 0.85, the highest Strong score at the conference, sitting within a dense pool of potentially aligned buyers.
- Mt Alexander, Andean Silver - 0.82, a Western Australian asset inside an increasingly Chile-focused portfolio.
- Cleveland tin, Elementos - a visible project with strong milestone-driven attention.
These are not confirmed sale processes. They are assets where visibility and strategic tension coexist.
Quietly stranded: 11 misfits receiving little attention
These are the classic off-market candidates.
DevEx Resources carries two Prime-tier portfolio orphans:
- Jimblebar Copper-Nickel - 0.88.
- Kennedy Rare Earths - 0.86.
Meanwhile, the market's attention is concentrated on DevEx's surging Nabarlek uranium flagship. That creates a textbook gap between portfolio ownership and market attention.
Waratah Minerals' Balama Central graphite project in Mozambique presents another kind of mismatch. It sits more than 10,000 km from the Lachlan-belt copper-gold story its owner is better known for.
These assets may require more investigative work, but they can also offer a stronger informational edge because there is less obvious competitive tension around them.
Core and running
Projects in the lower-right quadrant fit their owners and are receiving strong attention.
Their value case is usually execution rather than M&A: drilling, resource growth, studies, approvals or financing.
Core and quiet
Projects in the lower-left quadrant also fit their owners, but receive limited attention.
Some are early-stage. Others are simply waiting for capital and management attention to rotate back toward them.
What kind of news is driving the buzz?
Attention on its own does not tell you whether a company is drilling or simply talking, so we analyse the announcements.
Of the 70 exhibitor flagships we could score, 33 carry solid market attention. They split almost exactly in half.
16 are drill-bit-driven
Most of the newsflow around these projects concerns drilling, assays, geology and geophysics.
The leading examples are:
- Mt Oxide, True North Copper - 80% geological.
- Nabarlek, DevEx Resources - 67%.
- Bramaderos, Sunstone Metals - 60%.
This is the type of momentum most closely associated with changing geological understanding.
17 are milestone-driven
Their news is led by studies, financing, permitting and other development milestones.
Chalice Mining's Gonneville sits in this group because 2026 is its study-and-partnering year.
Milestone-driven attention is real progress. It is simply a different kind of excitement from a fresh discovery-and investors pricing exploration upside should know which one they are looking at.
Across the conference, the average exhibitor project's newsflow is approximately 36% geological, slightly above the 32% market baseline.
Noosa is still a drillers' room.
The returning class is accelerating
Eighteen exhibitors also presented at Noosa 2025.
Of the 15 with a complete two-year newsflow record:
- nine increased their flagship's share of voice year on year,
- three moved from silent to surging, and
- only two slowed materially.
The three moving from silent to surging were:
- Red Mountain lithium, Venari.
- Gilmore gold-copper, Linq.
- White Dam, PacGold.
Energy Transition Minerals' Penouta also went from silent to surging, but for a different reason.
Through 2026, the company:
- completed its acquisition of the Spanish tin-tantalum-niobium mine,
- cleared Spanish foreign-investment approval,
- secured the mining-licence transfer,
- published a mineral-resource update, and
- signed an offtake memorandum.
That is acquisition, licensing, resource and commercial progress rather than a fresh drilling story. It is a useful example of why the type of momentum matters.
Whatever else Noosa selects for, it appears to select for companies preparing to get louder.
The buyers may already be in the room
New this year, we mapped the corporate relationships between presenters, including:
- subsidiaries,
- joint ventures,
- substantial shareholders,
- option agreements, and
- direct share transfers.
Seventeen of the 72 exhibitors are already connected to at least one other presenting company through a shared major backer or direct corporate relationship.
Scotiabank, through its 1832 Asset Management arm, is a substantial holder in six presenting companies-the widest single institutional footprint in the room.
Six direct corporate links, joint ventures, option agreements and share transfers run between companies at the conference.
Why does this matter for M&A?
Several high-conviction projects on our list have a potentially aligned acquirer presenting only a few booths away. In some cases, the current owner and possible buyer already share the same institution on both registers.
That is the shortest path a deal can take.
High-conviction shortlist
Full component breakdowns are available in the complete report.
| Project | Company | Score / Tier | Quadrant | Why it stands out |
|---|---|---|---|---|
| Kvanefjeld | Energy Transition Minerals | 0.88 Prime | Shop window | Stranded by policy; attention never stopped |
| Jimblebar Cu-Ni | DevEx Resources | 0.88 Prime | Quietly stranded | Portfolio orphan beside a uranium-led company narrative |
| Kennedy REE | DevEx Resources | 0.86 Prime | Quietly stranded | A second high-scoring orphan in the same portfolio |
| Araxa Nb-REE | St George Mining | 0.85 Strong | Shop window | Brazilian critical-minerals asset with a dense pool of aligned buyers |
| Mt Alexander | Andean Silver | 0.82 Strong | Shop window | Western Australian asset inside a Chile-focused portfolio |
| Capricorn Copper | 29Metals | 0.74 Strong | Shop window | Copper asset flagged before its strategic review |
There are also four single-asset acquisition candidates-companies whose entire investment story is concentrated in one well-fitted project:
- Maronan Metals,
- Tesoro Gold,
- Tali Resources, and
- Southern Palladium.
How we do this
RadiXplore combines its live database of mining projects and corporate ownership with the full text of company announcements from the ASX and the Canadian exchanges.
Each project receives:
- A strategic-fit read, based on how its commodity, location and place in the portfolio compare with the rest of the owner's assets.
- A market-attention read, based on how much of the company's newsflow the project commands.
- A news-substance classification, distinguishing geological activity from financing, permitting and other corporate milestones.
- Relationship context, showing relevant shareholders, joint ventures and direct corporate links.
Both primary scores are benchmarked against the wider market.
The result is a screen for strategic-fit signals, not a valuation. Its purpose is to help corporate development, portfolio and investment teams decide where deeper investigation may be worthwhile.
The data in this article is a snapshot to mid-2026.
Access the full Noosa 2026 analysis
The public analysis includes:
- the interactive momentum and M&A matrix,
- the full quadrant breakdown,
- selected high-conviction project examples,
- the strategic-fit component chart,
- the project map, and
- the exhibitor relationship map.
The complete scored dataset-including all 419 Noosa projects, their group, shortlist detail and ownership context-is available to RadiXplore clients.
To arrange a Strategic Portfolio Briefing, contact contactus@radixplore.com.
The strategic-misfit rate at Noosa is around one in twenty, broadly in line with the wider market. The edge is knowing which 21-and this year, the potential deal flow is walking around with a lanyard on.
This article reflects the author’s views and RadiXplore’s data-driven analysis.
Strategic-fit scores are indicators based on available project, ownership, geographic, commodity and announcement data. They do not establish that a project is for sale, that its current owner intends to divest it, or that another party intends to acquire it.
The analysis is not financial advice, a valuation, or a recommendation to buy, sell or hold any security. Readers should conduct their own technical, legal, commercial and financial due diligence.